Single building utility monitoring report
Single building utility monitoring report : This page enables users to navigate to the building level and explore detailed energy consumption data for a specific asset.
Overview:
Refer to the Overview section for a concise summary of key metrics.
Daily consumption:
Refer to the Daily consumption section for insights into daily energy usage patterns.
Average weekday consumption:
Refer to the Average weekday consumption section for analysis of energy usage trends during weekdays.
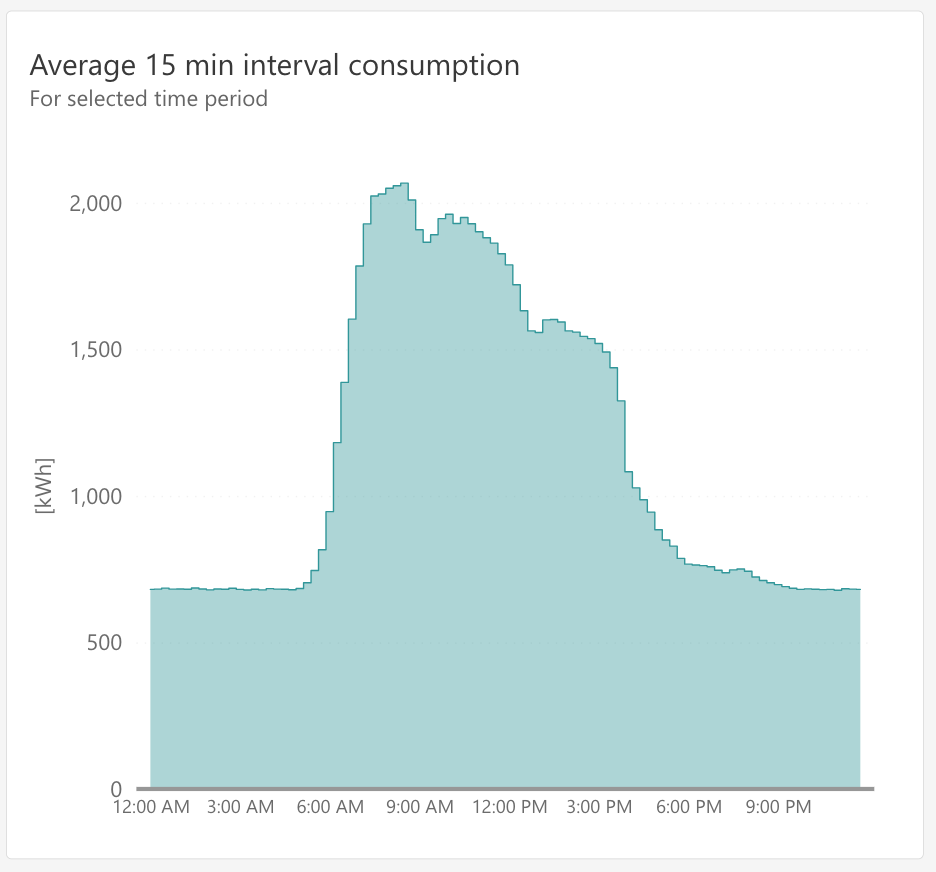
Average 15-minute interval consumption:
The average 15-minute consumption represents the energy consumed on average every 15 minutes throughout the day for the selected building and time period.
Key insights:
Understand peak and off-peak energy consumption periods.
Combined with occupancy data, this view aids in identifying consumption patterns and optimization potential.
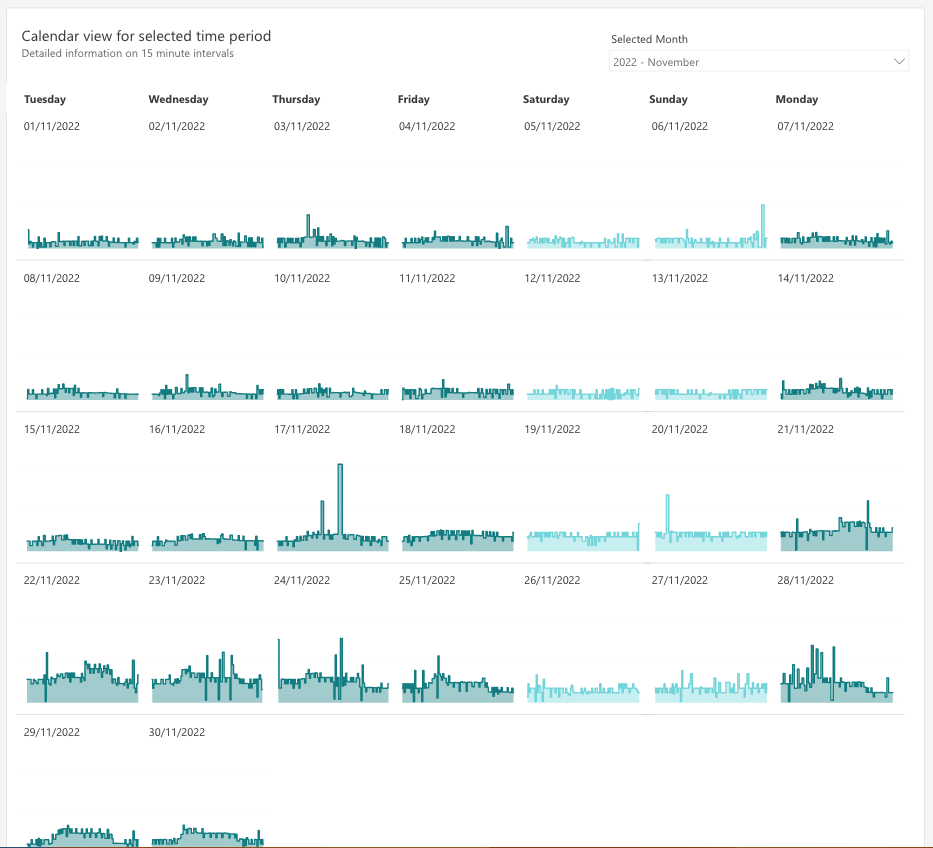
Calendar view for selected time period:
The 15-minute interval consumption illustrates energy usage every 15 minutes across each day of the selected month for the specified building.
Key insights:
Identify peak load periods during the selected month and quantify their intensity.
This view enables the detection of inefficiencies or wastage in energy usage, providing valuable information for optimizing consumption and implementing energy-saving measures for residential and commercial properties.
Monitoring energy consumption in 15-minute intervals aids in the early identification of potential issues or anomalies.
Chart available for: Electricity, Gas and Water.