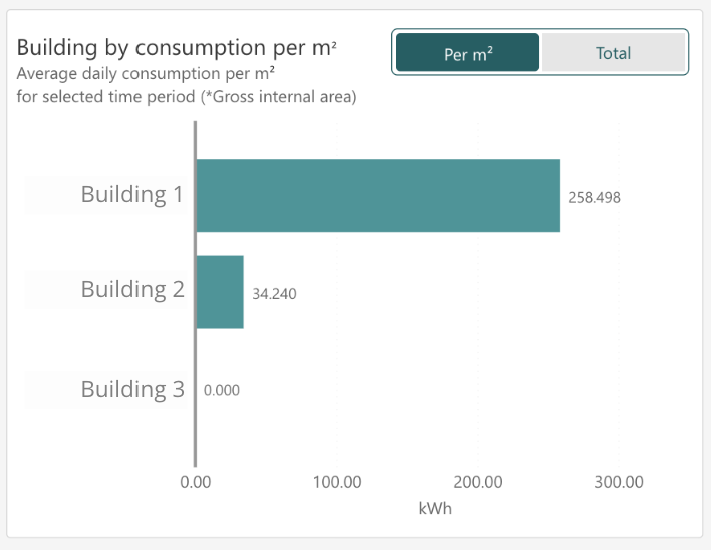
Building by consumption per m²/ total
The Consumption per m² represents the utility consumed in average on a day over the selected time period divided by the gross internal area for each building.
The Total consumption represents the utility consumed in total over the selected time period for each building.

Key insights:
Comparing utility consumption: Compare the utility consumption of the buildings in your portfolio and understand the general trend across your assets.
Spotting anomalies: Analyze the data to identify outliers in terms of utility consumption within your portfolio.
By examining these insights, you can gain a comprehensive understanding of utility usage across your buildings and identify optimization areas.
Note
Chart available for: Electricity, Gas and Water.