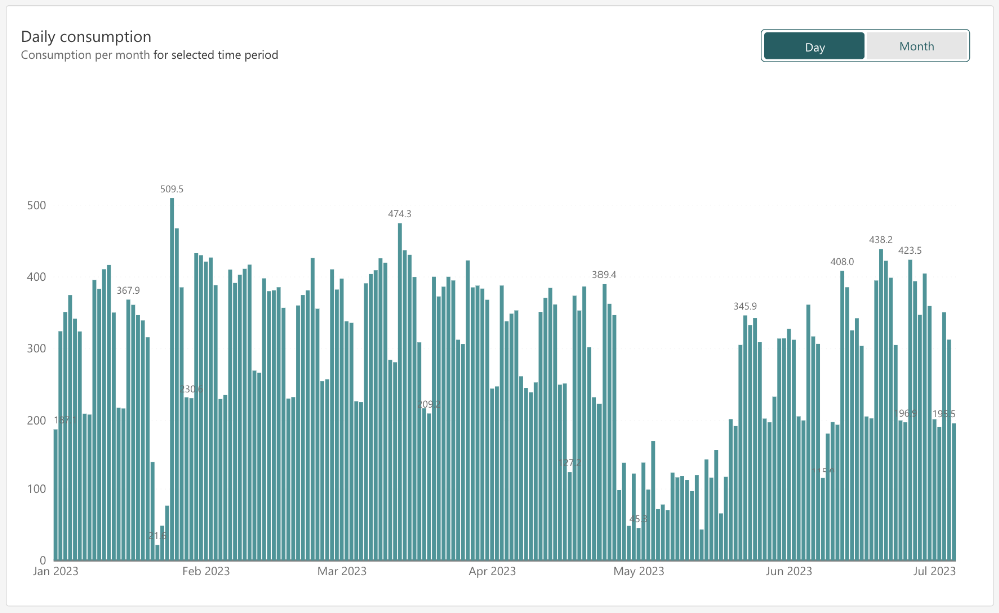
Daily/monthly consumption
The daily/monthly consumption represents the utility amount consumed on each day/month for the selected buildings and over a selected time period.

Key insights:
Evolution of consumption: Track historical data to identify trends and patterns.
Identifying anomalies: Detect unexpected spikes or dips that require further attention.
By analyzing these insights, you can optimize your utility costs based on the observed trends but also adjust the way you operate your buildings.
Note
Chart available for: Electricity, Gas and Water.