Insights overview
Insights offer diverse KPI dashboards to comprehend key metrics related to costs, leases, resource usage, carbon emissions, and real estate risks, tailored to the chosen dashboard.
In this section, we only describe standard dashboards. Those customized to your organization's specific requirements are not described here.
Filter possibilities and the level of detail under Sustainability or Asset management highly depend on the data available.
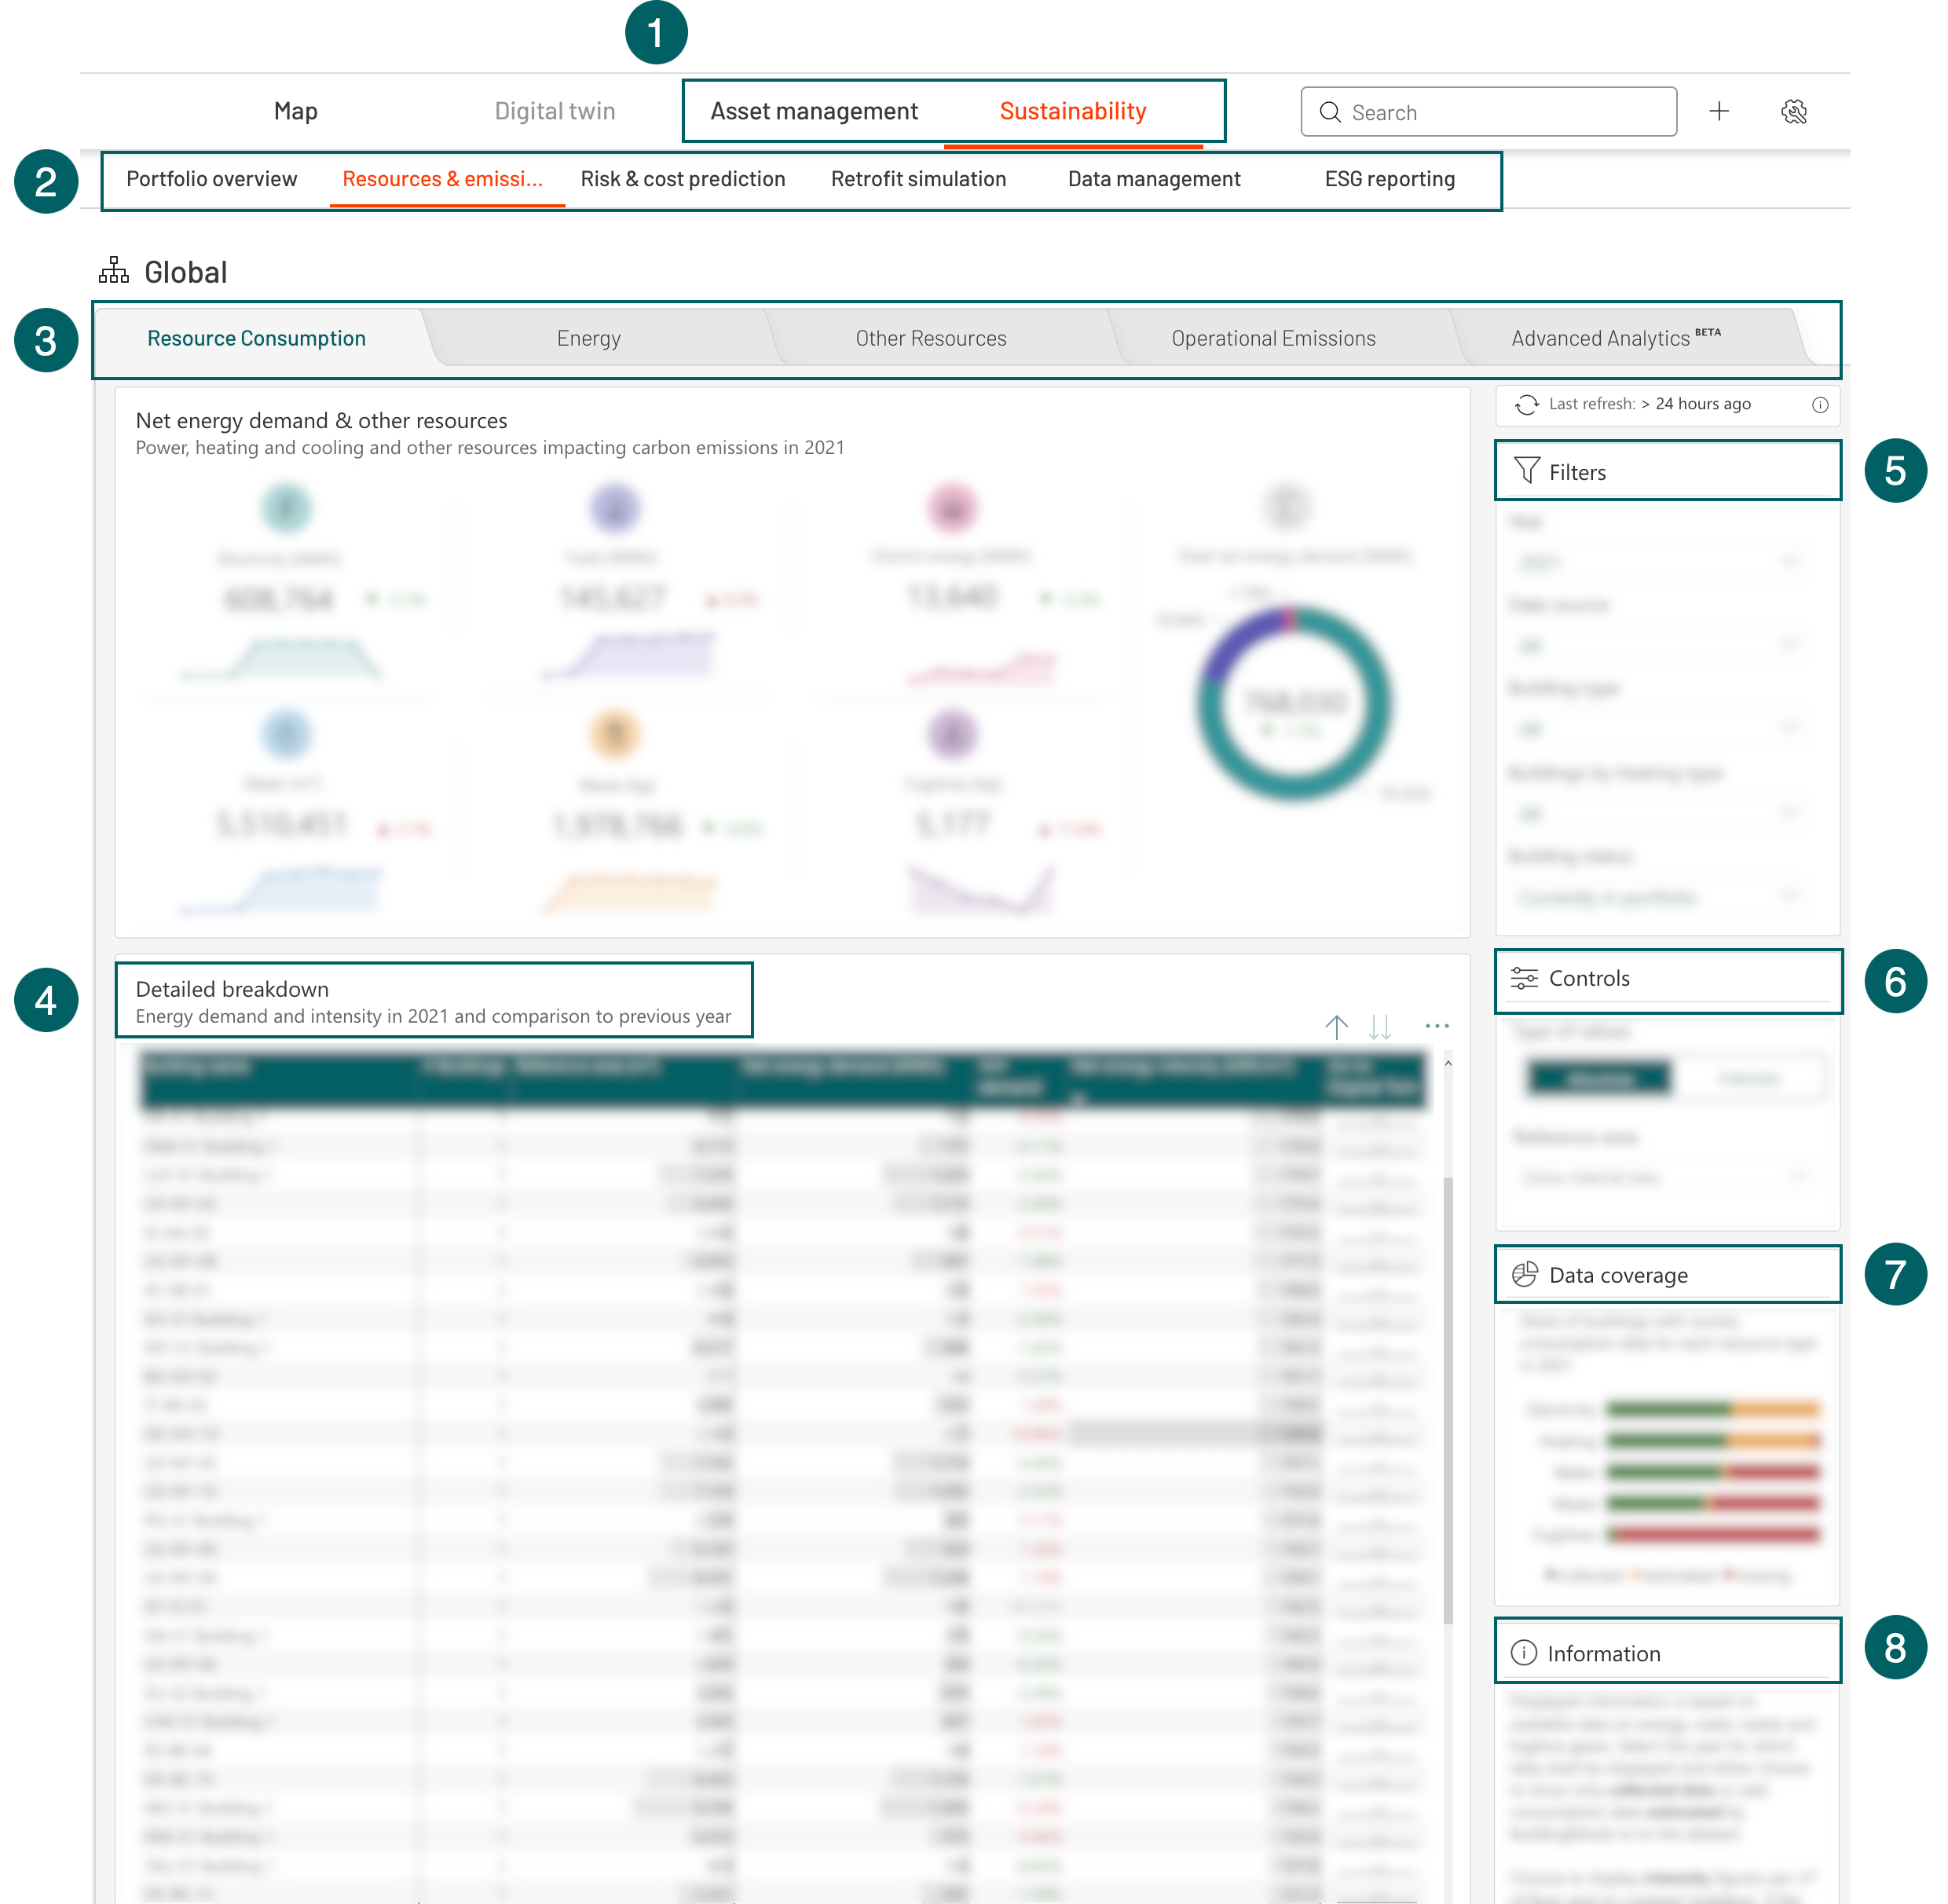
Category tab. Depending on the purchased modules you can view the Sustainability, Asset management, or both tabs.
List of available dashboards.
Specific topics of the dashboard can be selected via respective tabs. Dashboards consist of KPIs, charts, and tables depending on the data foundation.
Detailed breakdown: Details on the data used for the KPIs displayed in the dashboard.
Filter: Depending on the dashboard, you can set different filter options, like a specific year, building type, or heating type.
Controls: Depending on the dashboard, you can switch between value types, like absolute or intensity, and calculation approaches, like location-based and market-based.
Data coverage shows what portion of the portfolio is represented in the displayed data. Whether it's 10% or 90% of the buildings, it significantly affects how the information is understood. Data coverage is provided only for specific dashboards.
Additional information on the dashboard's KPIs, calculations, or standards used is displayed here. The information is available for all dashboards.
You can adjust KPI contexts in dashboards through geographic and custom views. In the Sustainability or Asset Management tabs, dashboards start with data and KPIs for all real estate.
Selecting a country or organizational item from the left menu filters the data.