Overview section: Understanding utility consumption
Gain insights into electricity, gas, and water consumption across your buildings. This page provides a clear overview of the consumption of a portfolio or sub-portfolio.
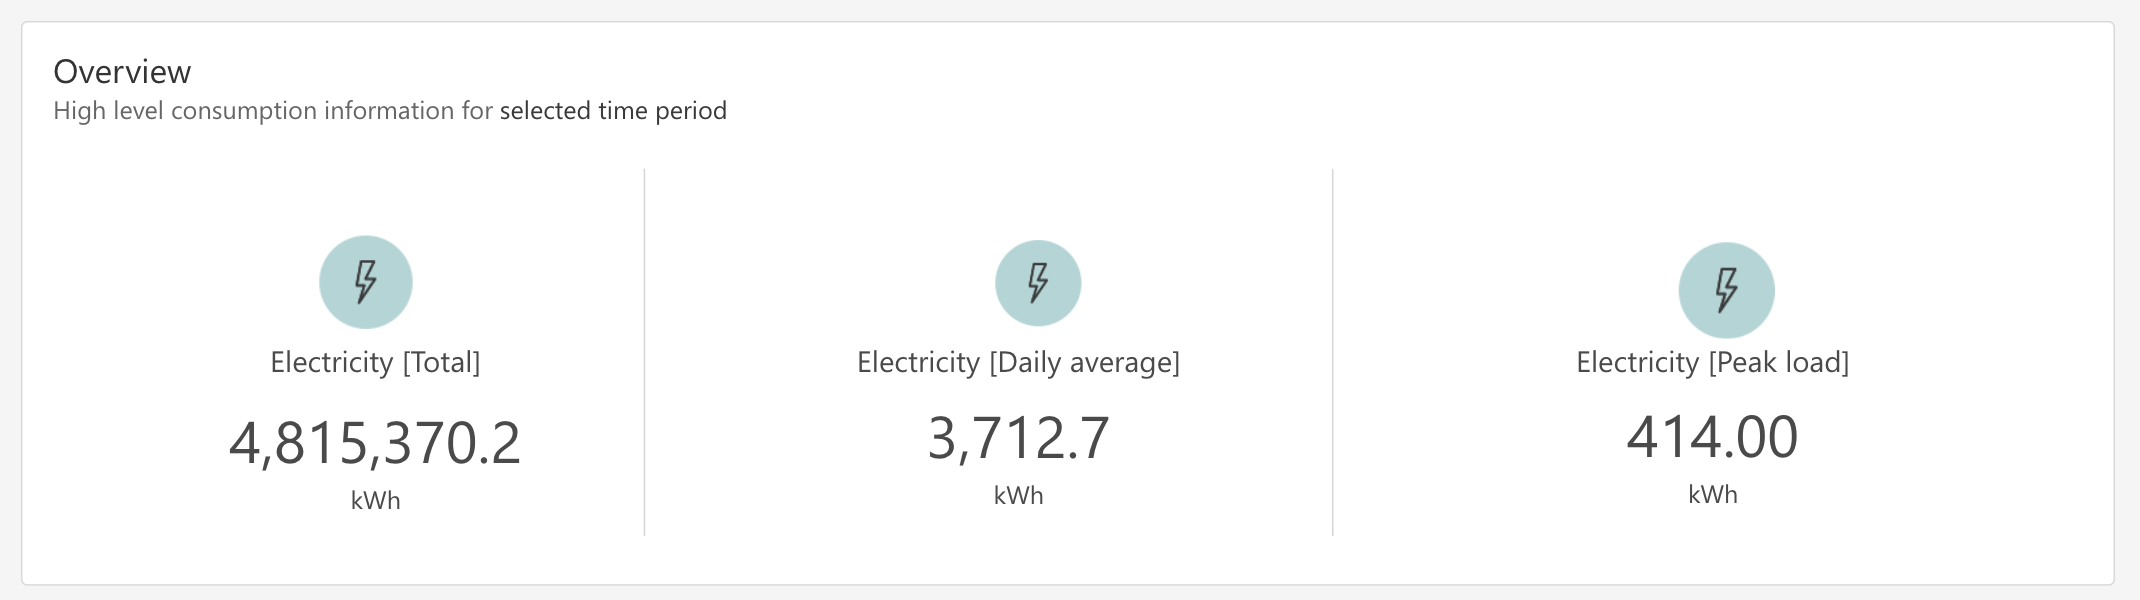
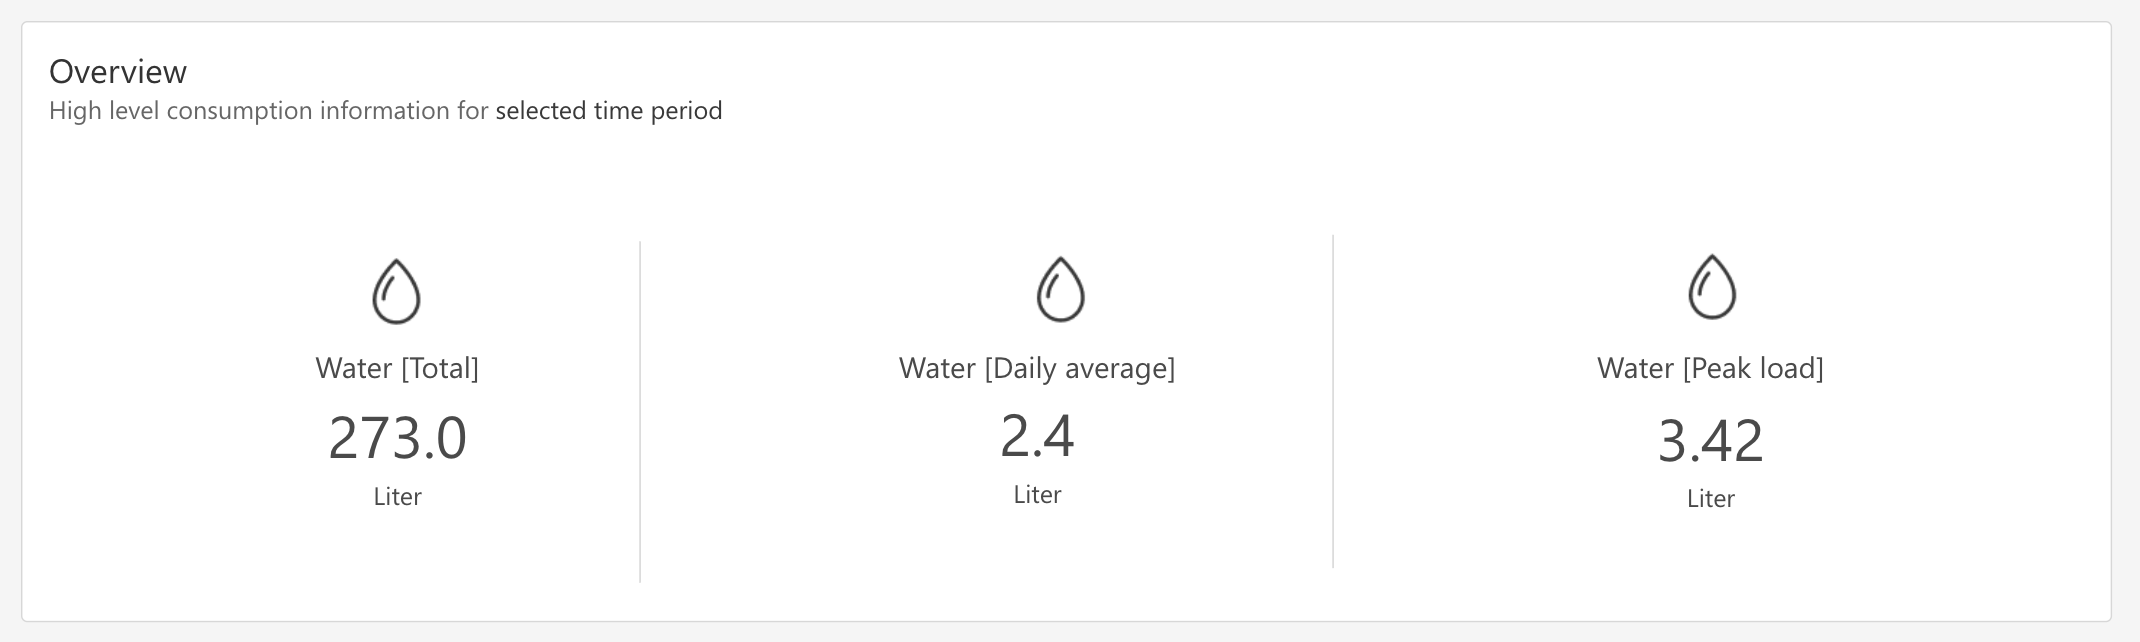
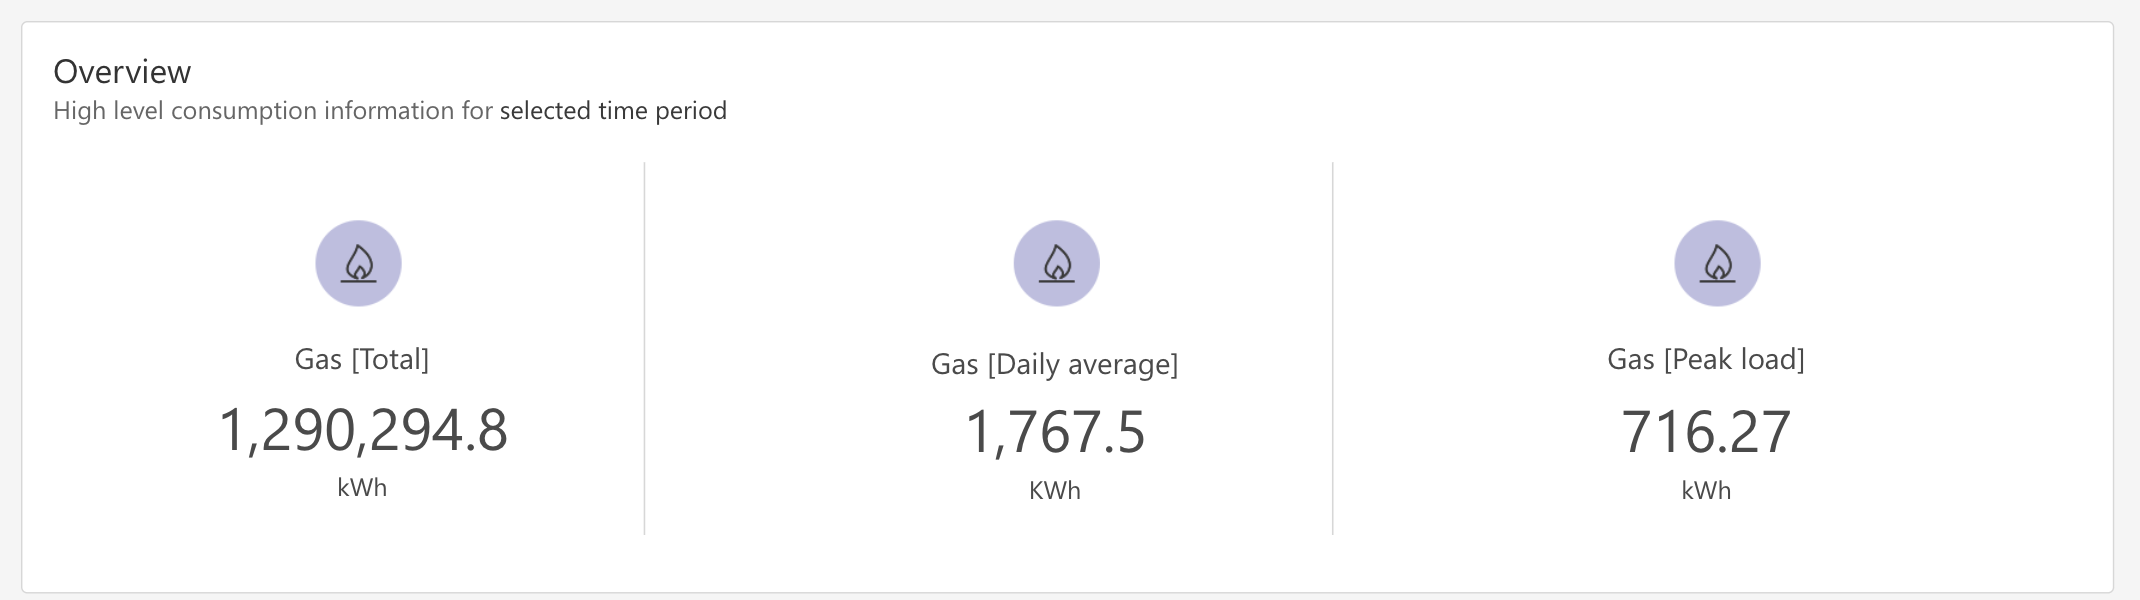
Total consumption
The Total consumption metric represents the combined amount of electricity/gas/water consumed across the selected time period and buildings or segments of your portfolio. It gives you a broad understanding of the overall utility usage, helping you assess the collective impact on resource utilization.
Daily average
The Daily average metric shows the average amount of electricity/gas/water consumed per day across the selected time period and for the selected buildings or sections of your portfolio. This enables you to grasp the typical utility consumption patterns, facilitating better resource management and optimization strategies.
Peak load
The Peak load metric indicates the highest level of electricity/gas/water consumption recorded for the selected time period and for the buildings or sections of your portfolio. Understanding peak load helps you identify the maximum demand and adjust your energy contracts accordingly.
How to display the data
Select buildings or portfolio segments: Choose the buildings or segments of your portfolio you wish to analyze from the left menu.
Choose time period: Specify the time period for which you want to view utility consumption data.
By leveraging the insights provided on the overview section, you can make informed decisions to optimize utility consumption and enhance sustainability across your portfolio.