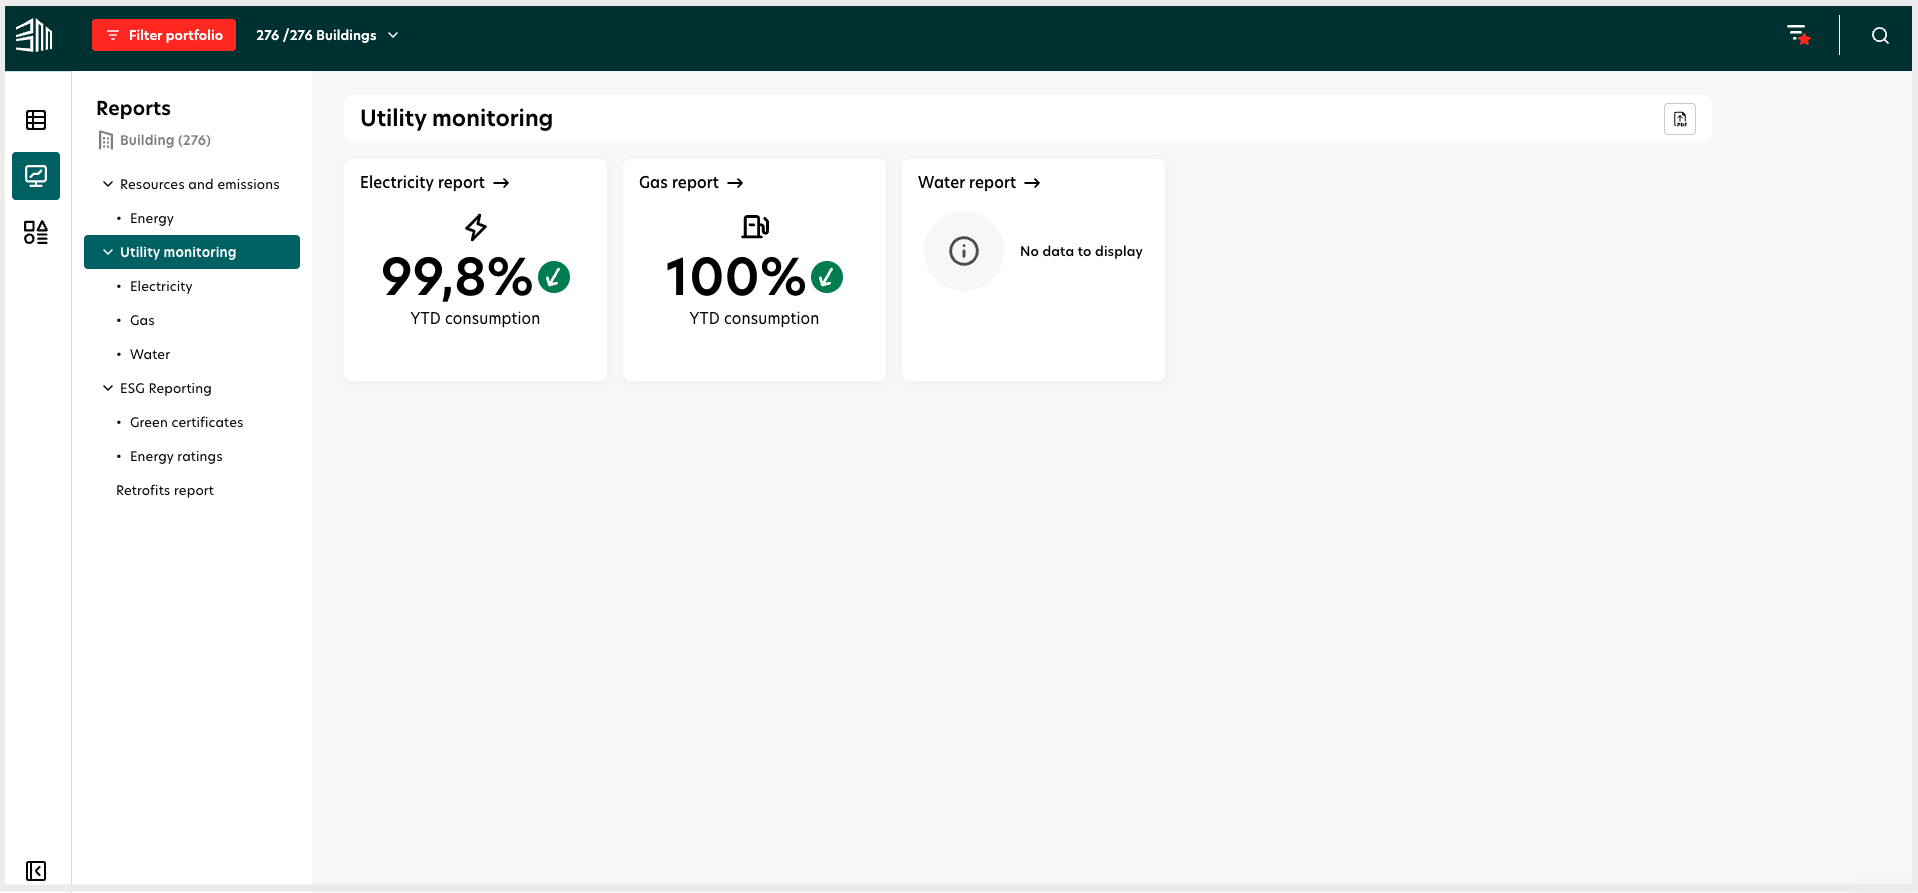
Utility monitoring
Utility monitoring involves collecting, analyzing, and reporting data on utility usage for a property. The report provides insights on energy consumption patterns and anomalies and helps optimizing the usage of electricity, gas and water for each building.
Relevance of utility monitoring
Energy performance
Sustainability goals: Highlights opportunities for energy-saving initiatives.
Regulatory compliance: Ensures compliance with energy consumption and efficiency regulations.
Operational efficiency
Preventive maintenance: Detect anomalies and data gaps for an early prevention of issues in the buildings.
Optimized operations: Allows for adjustments based on comprehensive utility data.
Value enhancement
Property value: Efficient utility management can increase property value.
Marketability: Attracts environmentally conscious tenants and buyers.
Access utility monitoring:
Select the Report icon in the left menu.
Select Utility monitoring.
Access the building view of Utility monitoring:
1. Go to Data management tab.
2. Select the desired building.
3. Select the Report icon in the left menu.
4. Select Utility monitoring.
Distinct views in Utility monitoring
BuildingMinds' Utility monitoring feature offers three distinct data views: above building level, building level and rental unit level. Each view provides unique insights into utility consumption patterns.
Above building level view
The above building level view allows users to analyze utility consumption data across multiple buildings within a selected level, such as a site, geographical group, or custom group. This holistic approach offers a comprehensive overview of energy usage patterns and trends across the portfolio.
Key parameters influencing analysis:
A chosen group of assets: By selecting assets in the filter portfolio section, users can focus their analysis on specific groups of buildings.
Applied filters: Users can refine the analysis by adjusting parameters such as time period, and building characteristics.
User permissions: Each user sees the utility data of the buildings he/she has permission to view. All other buildings are excluded.
Building level view
The building level view provides a detailed analysis of utility consumption data for a single building selected by the user. This focused approach allows for examining the energy usage patterns of individual buildings.
Key parameters influencing analysis:
Selected building: The analysis focuses solely on the consumption data of the selected building.
User permissions: Permissions ensure that only authorized individuals can access and analyze utility consumption data at the building level.
Rental unit level view
This view displays the key performance indicators (KPIs) for the consumption of each available utility associated with the selected rental unit. It provides insights into usage patterns, helping users analyze and better understand the consumption trends for each utility.
By reviewing this information, users can make informed decisions and identify potential areas for optimization or further investigation.
Commonalities between both views:
Feature | Commonalities |
|---|---|
Utility types | Electricity, gas, water |
User permissions | Data access and analysis based on user permissions |
Differences between both views:
Feature | Above building level view | Building level view |
|---|---|---|
Scope | Multiple buildings within a selected level | Single building selected by the user |
Analysis focus | Comprehensive overview of energy usage patterns and trends | Detailed analysis of energy usage patterns |
Asset selection | Focus on groups of buildings (site, geographical, custom) | Focus on a single building |
Filters | Time period, building characteristics | Time period, individual meters, comparison parameters |
Data anomalies
Users can see the list of buildings where data anomalies have been identified for the selected utility and time period. They can navigate to the report for each building or to the list of meters impacted.
The calculations are based on the time period selected (eg.: Jan 2024 to March 2024 and the structure level selected. eg.: Germany).
Days with anomalies = number of days per building where data anomalies have been identified for the [selected utility type] and the [selected time period].
Meter impacted = number of meters in each building where data anomalies have been identified for the [selected utility type] and the [selected time period].
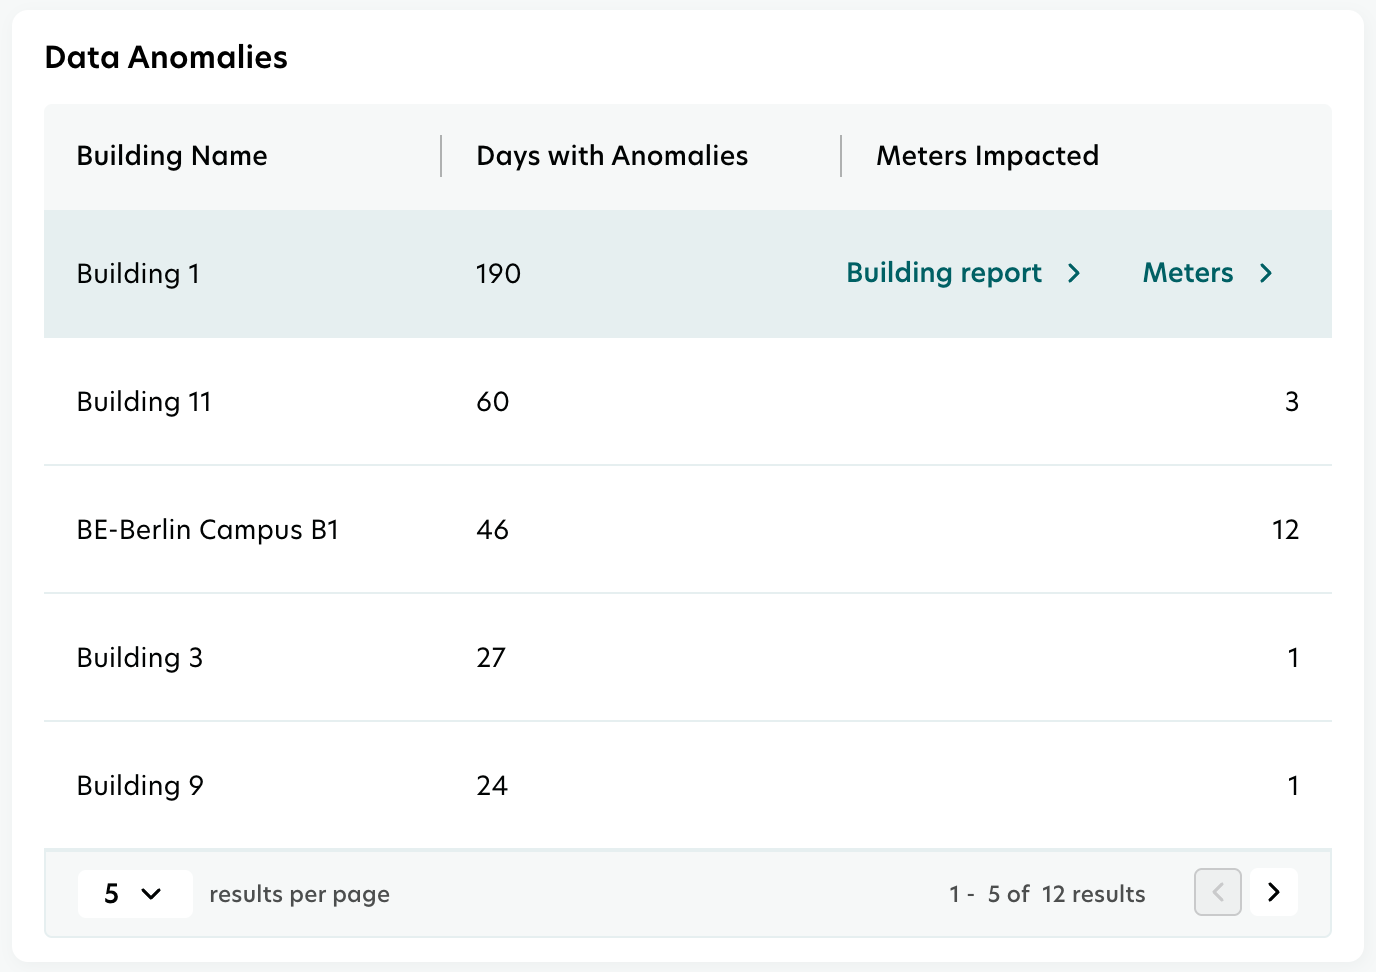
Anomalies can be missing data or consumption values that are higher or lower than the expected values.
Time filter: This table is impacted by the time filter selection.
Default selection: last 12 months.
User can select any dates in the time filter.
Other filters: This chart is impacted by the general filters.
Building type: the data set displayed is limited to the buildings of the selected types (eg.: Office). By default, all types are selected.
Ownership: the data set displayed is limited to the ownership of the selected types (eg.: Owner). By default, both ownership types are selected.
Area: the data set displayed is limited to the buildings of the selected size (eg.: 1000 to 2000 m2). By default all area sizes are selected.