Portfolio filters
Filters are a powerful feature in the platform, allowing you to customize your data view and generate precise reports. This guide will help you understand how to use filters effectively to manage and analyze your real estate portfolio.
Applying filters
The new platform offers a variety of filters to help you narrow down your data sets according to specific criteria.
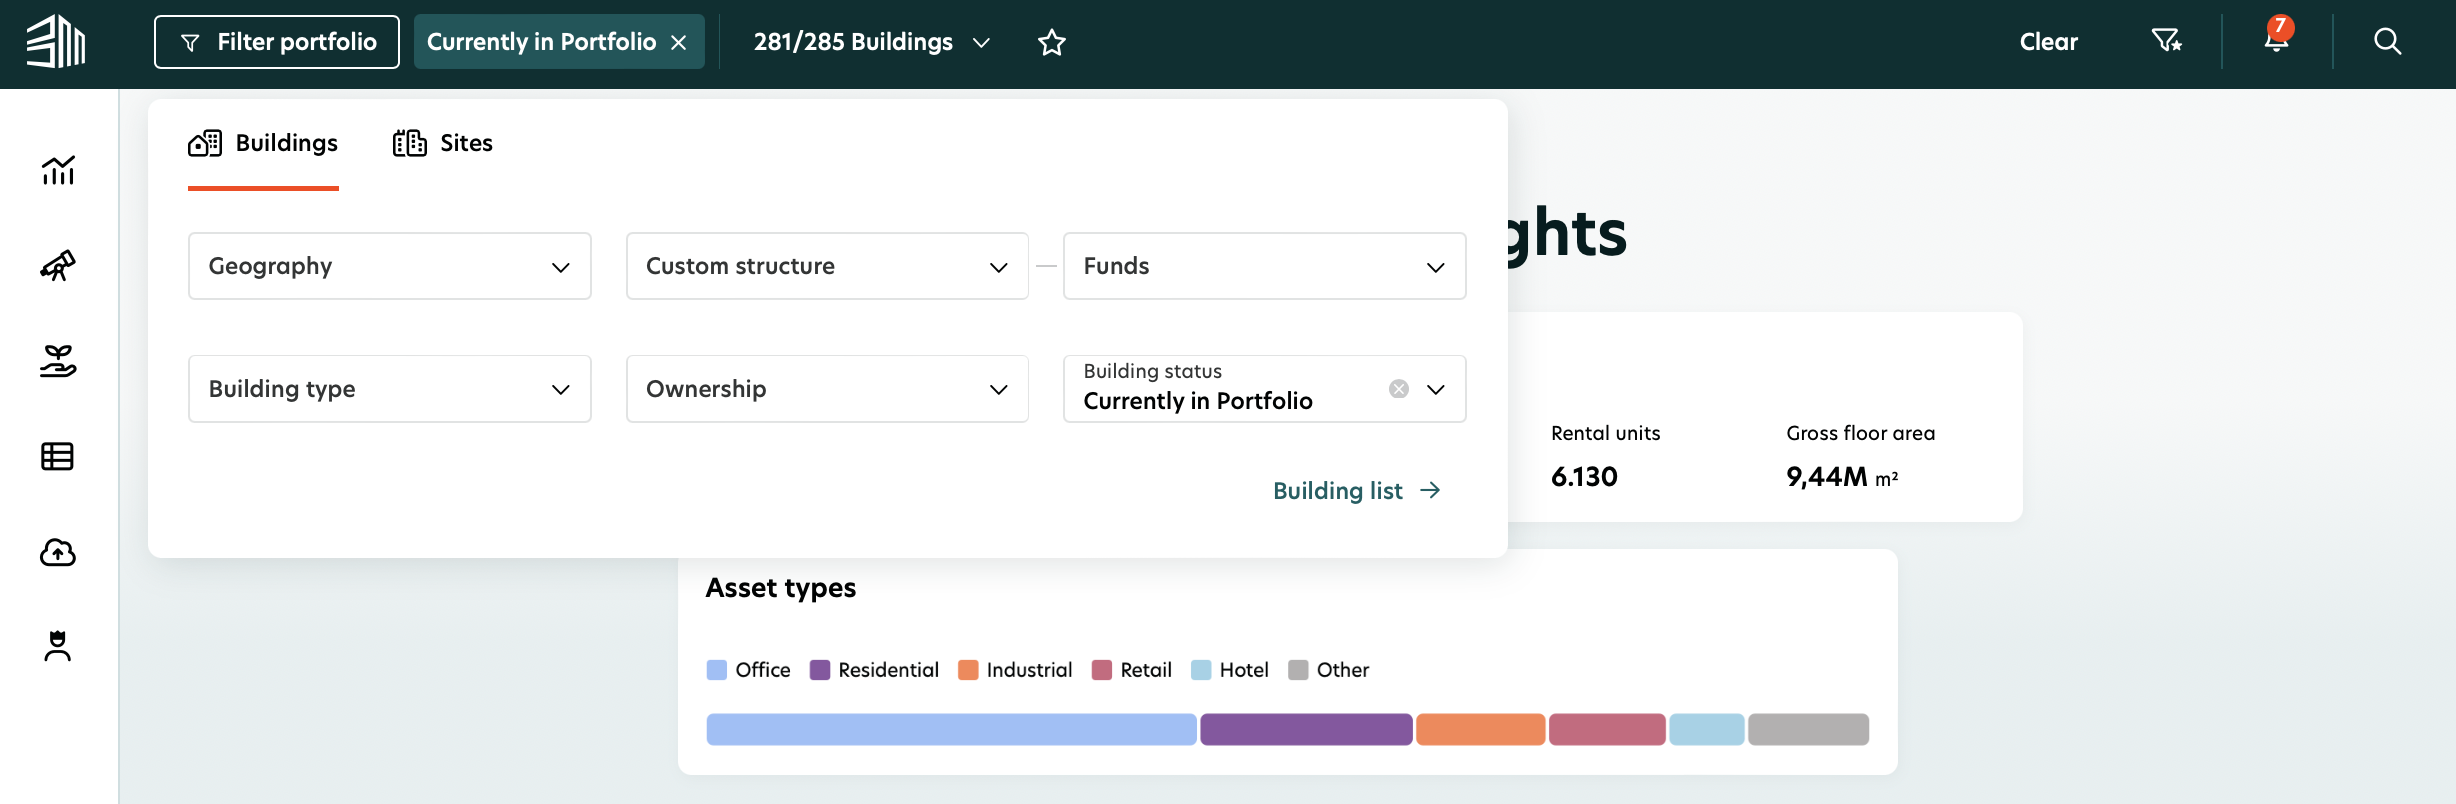
The Building filter categories include:
Geography: Filter buildings by their geographical location, such as Europe, Africa, Asia, and North America. This allows you to focus on specific regions or global views.
Custom structure: Filter buildings based on which specific Custom structure they belong to. For example, Corporate, Investment, etc.
Building type: Filter buildings by type, such as education, health care, hotel, industrial, lodging, leisure & recreation, mixed use, office, other, residential, retail, and technology/science. This is useful for analyzing specific sectors within your portfolio.
Ownership: Filter buildings based on ownership status, including owner and tenant. This helps you separate buildings you own from those you lease.
Building status: Filter buildings based on their status in your portfolio, such as previously in portfolio, currently in portfolio, and future acquisition. This is useful for tracking the lifecycle of your assets.
The Sites filter categories include:
Geography: Filter sites by their geographical location, such as Europe, Africa, Asia, and North America. This allows you to focus on specific regions or global views.
Custom structure: Filter sites based on which specific Custom structure they belong to. For example, Corporate, Investment, etc.
Site type: Filter sites by type, such as education, health care, hotel, industrial, mixed use, office, residential, retail, and technology/science. This is useful for analyzing specific sectors within your portfolio.
Site status: Filter sites based on their status in your portfolio, such as previously in portfolio, currently in portfolio, and future acquisition. This is useful for tracking the lifecycle of your assets.
Example:
Click on the Filter portfolio button at the top of the screen.
Select the desired filters from the drop down menus or sliders.
Filters are automatically applied to the building selection.
Clicking on Building list or Site list, you will be able to see only the buildings/sites that fall under your selected criteria.
Managing data sets
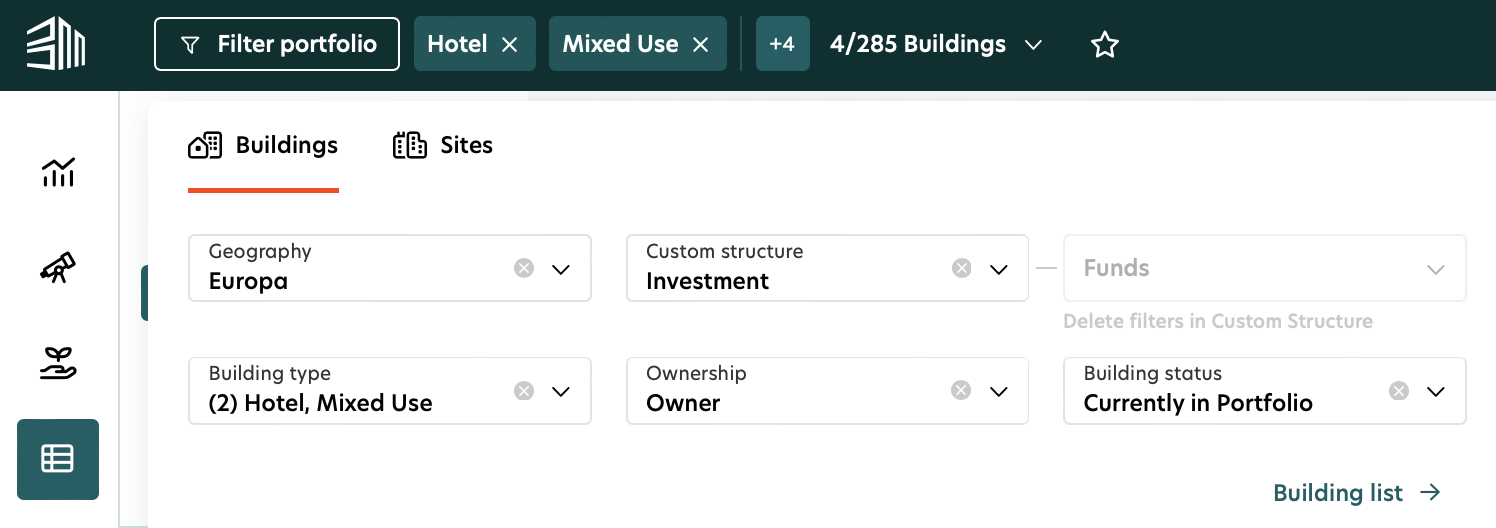
Creating custom data sets: Apply multiple filters simultaneously to create a custom data set that meets your specific needs. For example, you can filter buildings located in Europe, with a building type of office, and owned by you. This customized view allows you to focus on the most relevant subset of your portfolio.
Adjusting filters dynamically: Adjust filters without navigating away from the current view. This allows you to refine your data set on the fly, making it easy to explore different aspects of your portfolio.
Example:
Filter buildings by Geo tags: Select Europe.
Filter by Custom structure: Select Investment.
Filter by Building type: Select Hotel and Mixed Use.
Filter by Ownership: Select Owner.
Filter by Building status: Currently in Portfolio.
Apply the filters to see a customized list of buildings based on your criteria.
Detailed filtering
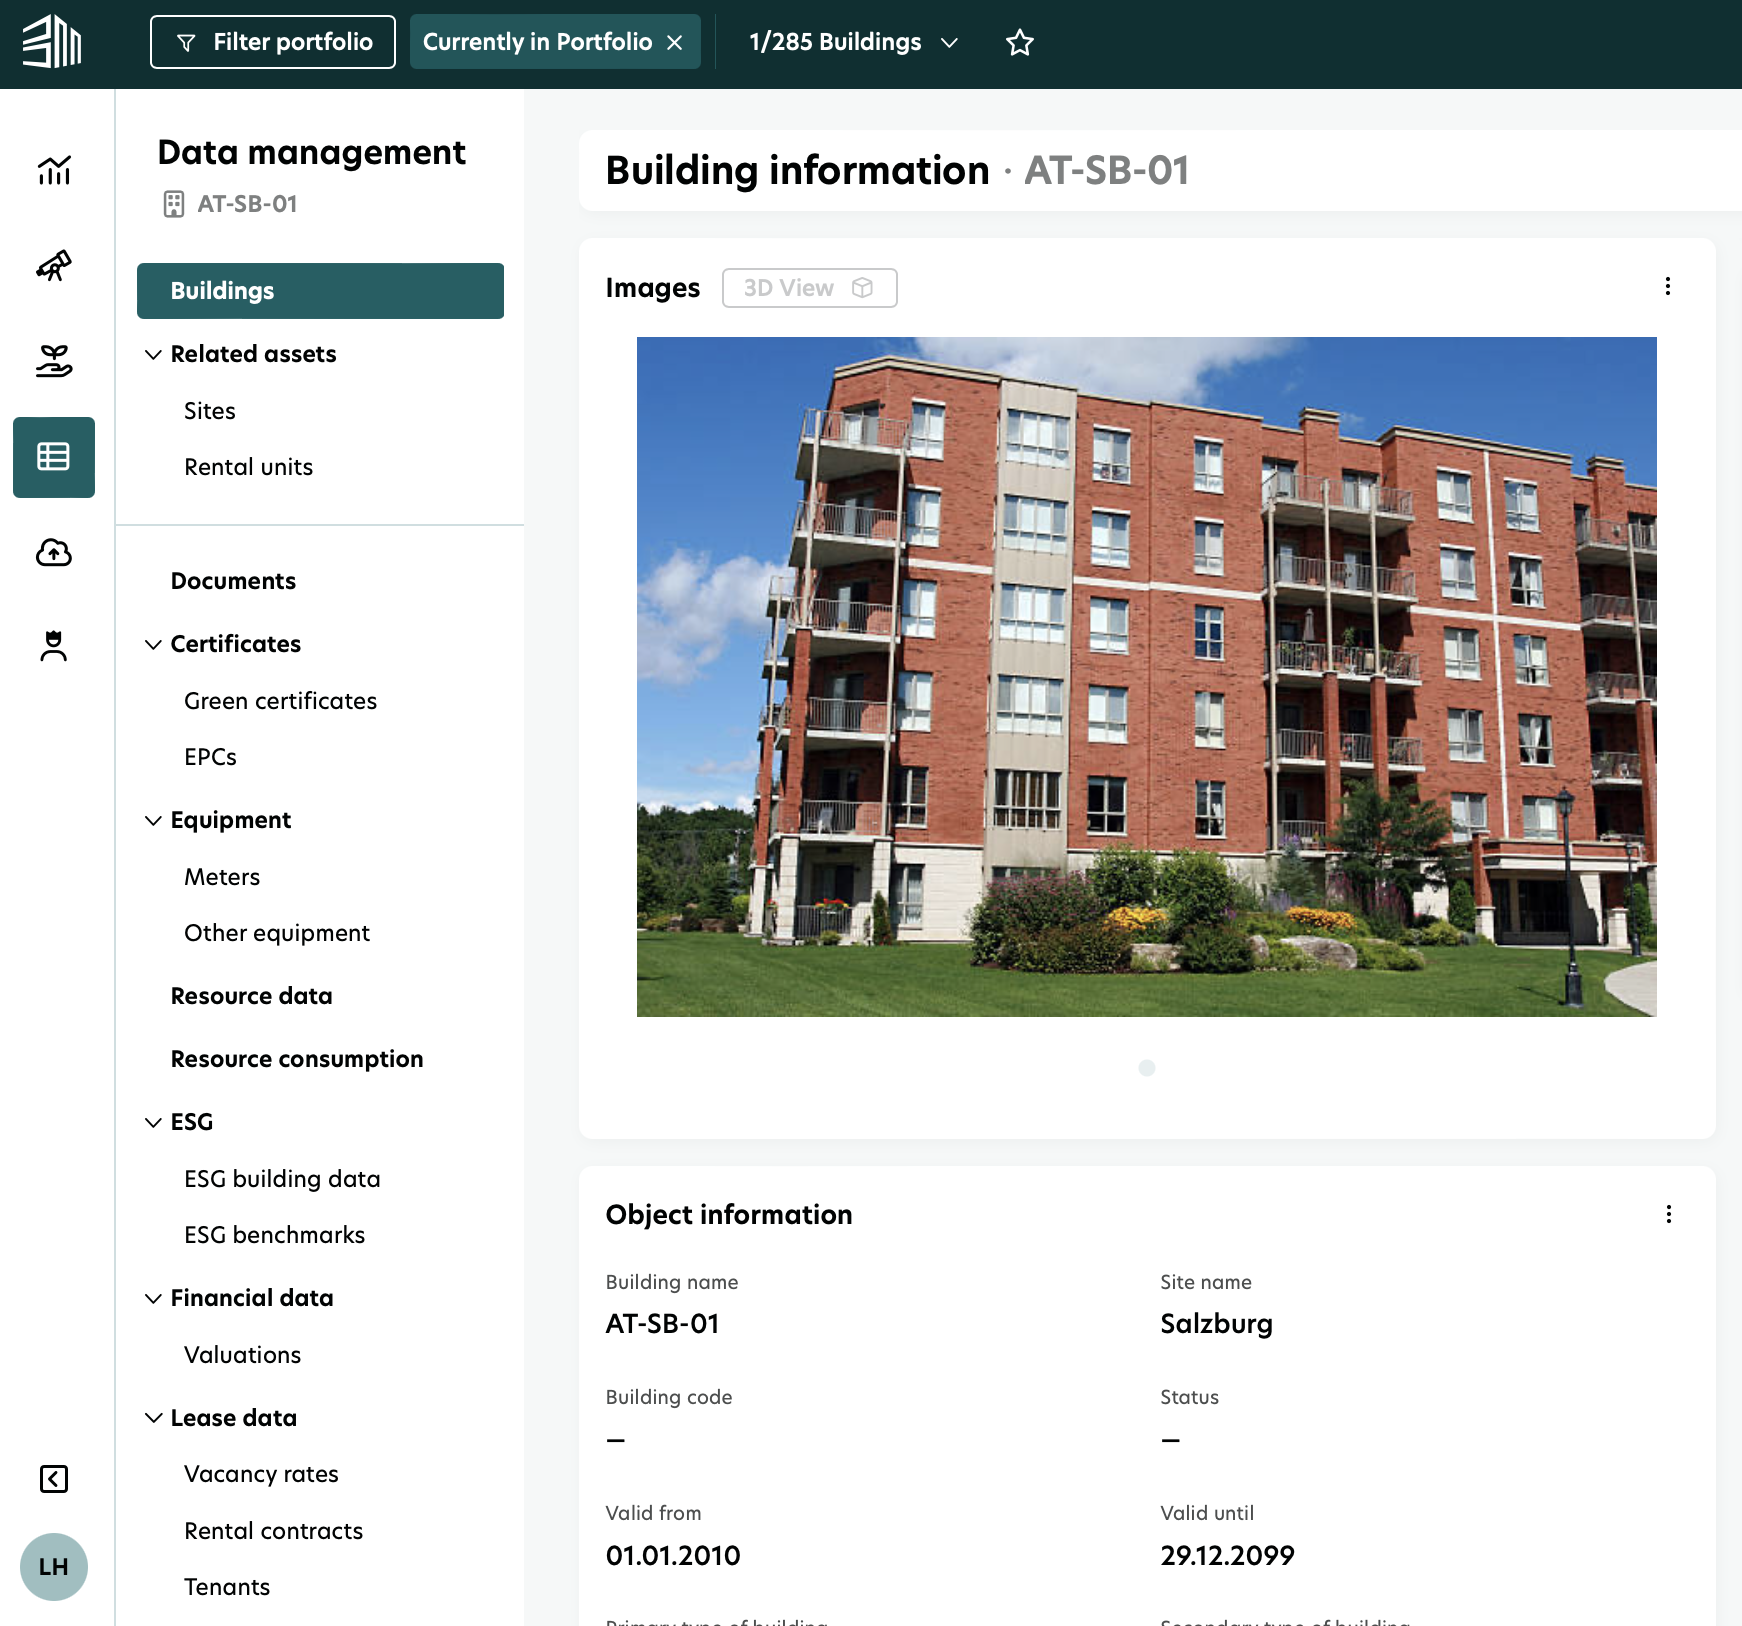
Accessing detailed views: After applying filters, click on any building or data set to access detailed information. This provides a closer look at the specific attributes and performance metrics of the selected buildings or sites.
Layered filters: Apply additional filters within the detailed views to further refine your data. For example, within a filtered data set of office buildings in Europe, you can further filter by Building status or Building type to narrow down to the most relevant assets.
Example:
After filtering by Office buildings in Europe, click on a specific building.
Apply additional filters, such as Building status or Building type, to refine your view further.
Using filters for reports
Previously, viewing data for a selected data set was not as straightforward and required navigating through multiple tabs. Now, the new platform allows you to view data for a selected data set more easily and efficiently.
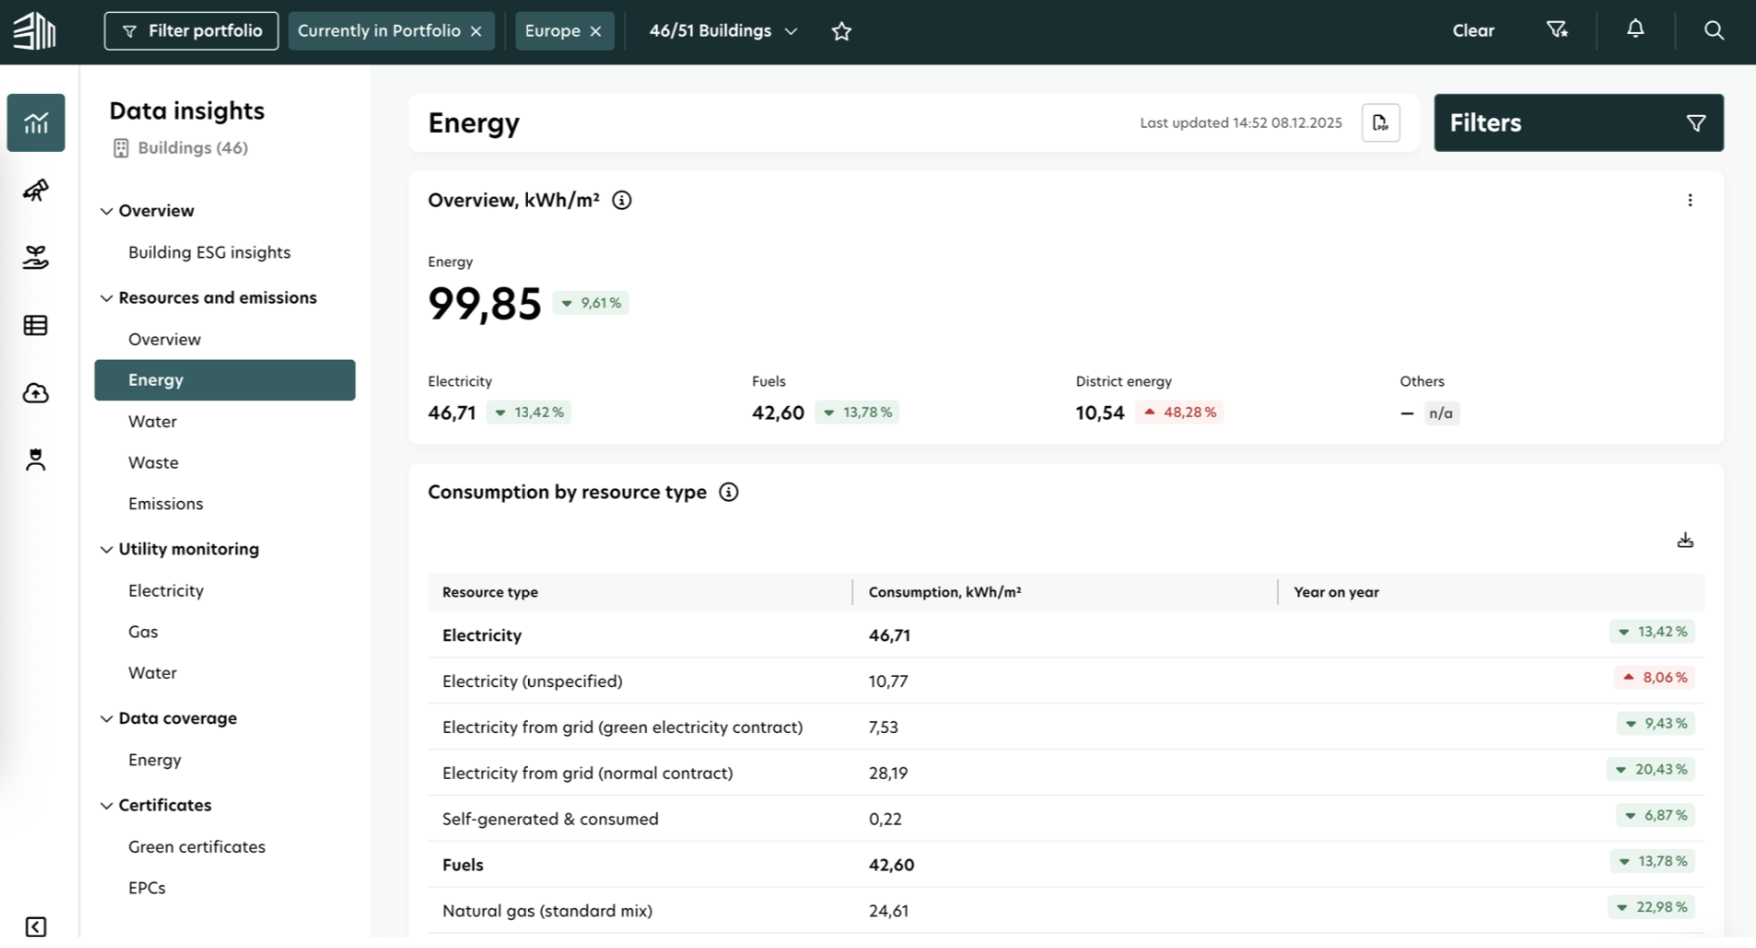
Generating reports: Use the filters to generate reports for specific buildings or aggregated data sets. For instance, you can generate a report on energy consumption for office buildings in Europe. This ensures that the reports are relevant and focused on the specific areas of interest.
Custom reports: Customize reports by applying filters that match your specific criteria. This ensures that the reports are tailored to your exact needs and provide relevant insights.
Example:
Apply filters to select Office buildings in Europe.
Navigate to the Resources and emissions section under Data insights.
Select the desired report type (e.g., Energy).
Generate the report to see the filtered data.
Filters are essential for customizing your experience on the platform. Utilize the available filter options - Geo tags, Custom structure, Type, Ownership, and Status - to manage data sets, generate tailored reports, and effectively analyze your real estate portfolio. This will help you achieve a more precise and relevant analysis of your assets.