EU Taxonomy assessment dashboard
The EU Taxonomy assessment dashboard is a comprehensive tool designed to aid users in evaluating the alignment of their assets with the EU Taxonomy criteria. This dashboard provides essential insights into the alignment status, gross asset values, and areas of assets according to the EU's sustainability principles.
Key features and functionalities
Alignment overview
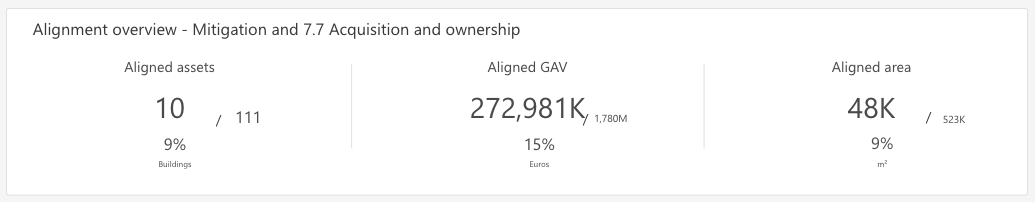
The Alignment overview section presents data on the assets' alignment with EU Taxonomy. Here, users can view:
The number of EU taxonomy-aligned assets.
The total gross asset value (GAV) of these aligned assets.
The overall area covered by aligned assets.
Substantial contribution and Do No Significant Harm
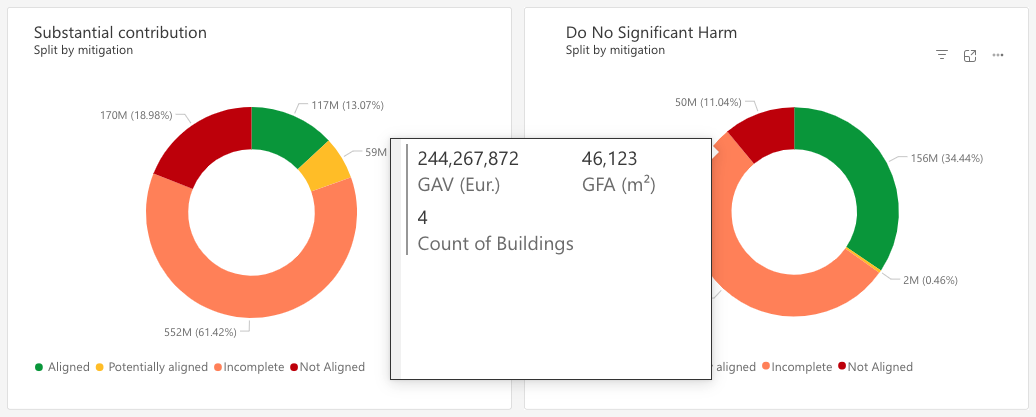
This section is represented by donut charts which categorize assets based on their gross asset value into four groups:
Aligned
Potentially aligned
Incomplete
Not aligned
These charts help answer:
What is the GAV of aligned assets?
How many assets fall into each category?
EU Taxonomy overview
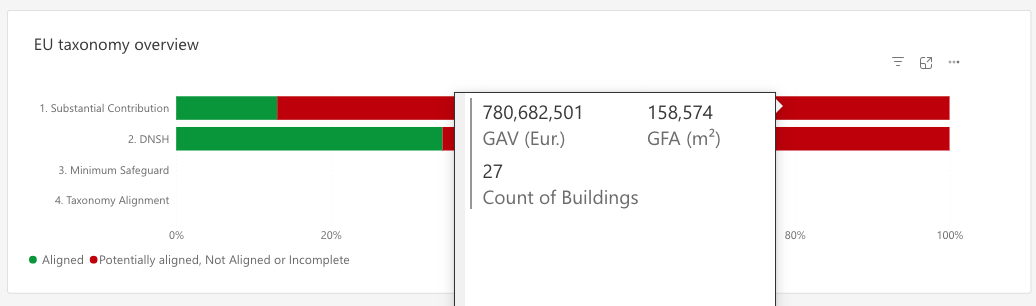
The EU Taxonomy overview section provides a high-level summary of assets’ alignment with key EU Taxonomy principles, including:
Substantial contribution
Do No Significant Harm (DNSH)
Minimum safeguard
Users can hover over elements to get more details such as percentages of fully aligned and incomplete assets.
Detailed breakdown
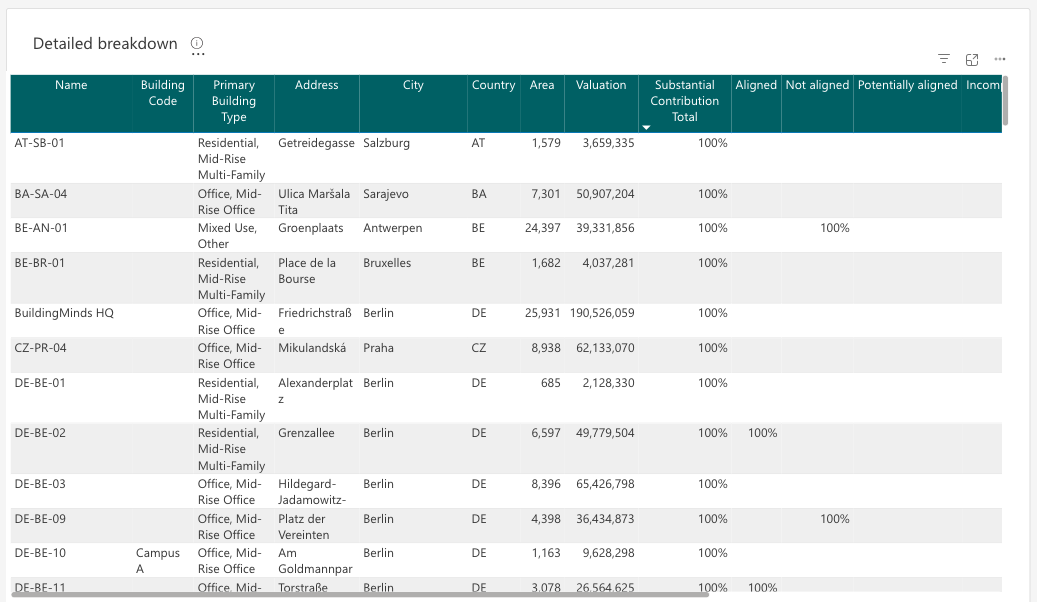
The Detailed Breakdown table allows users to explore asset-specific information. This includes:
Asset name, primary building type, address
Area, valuation, and substantial contribution totals (in percentage)
DNSH totals (in percentage)
Users can sort the data based on various columns for a customized view.
Filters, Data coverage, and Information
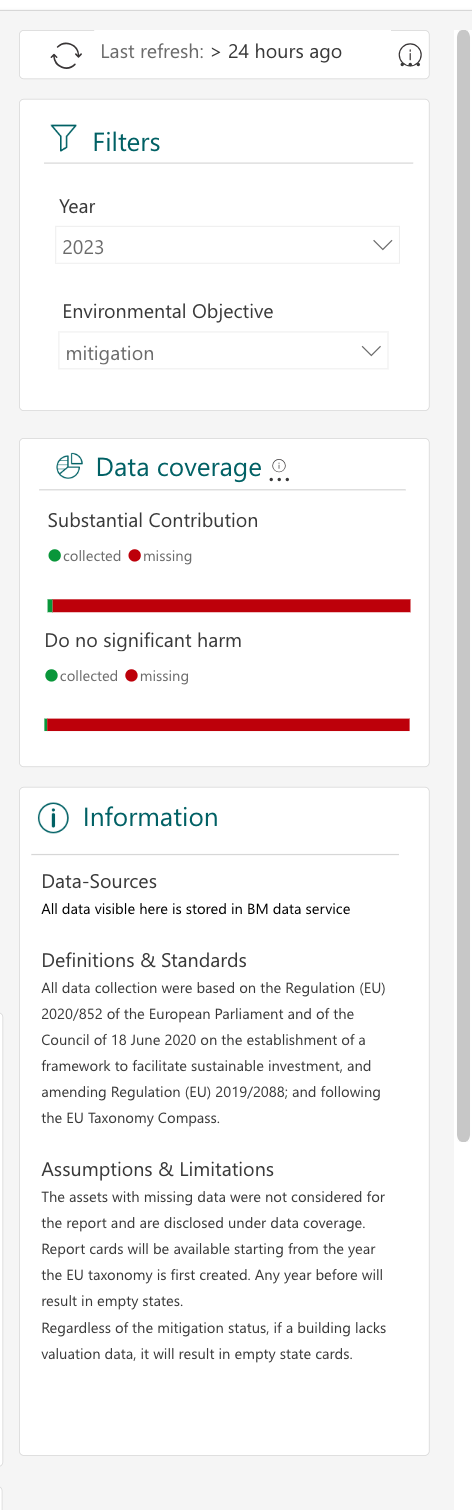
The Filters, Data coverage, and Information panel, located on the right, enables users to:
Apply filters by year to refine the view.
Check data coverage for substantial contribution and DNSH, both in terms of collected and missing data.
Access a Definitions & Standards section to understand key terms and limitations.
Chart learnings
Each section includes insights into what specific data points represent. For example:
Alignment overview:
Indicates the extent of EU taxonomy alignment by asset.
Substantial contribution and DNSH:
Provides insights into the alignment status based on asset GAV.
Detailed breakdown:
Highlights which assets are aligned, their locations, and what data might be missing.
Please note that all charts rely on the availability of the building's Gross Asset Value (GAV). If the GAV is unavailable, the widgets will display "empty" and "not available" information.