Stranding-Risiko (CRREM) Bericht
Der Stranding-Risiko-Bericht hilft Ihnen, die Umweltleistung Ihrer Vermögenswerte zu überwachen und zu verstehen. Er vereint wichtige Nachhaltigkeitskennzahlen - wie Energieverbrauch und betriebliche Emissionen - sodass Sie eine umfassende Übersicht über die Ressourceneffizienz erhalten und sehen können, wo Verbesserungen erforderlich sein könnten.
Zugriff auf den Bericht
Wählen Sie das Planung und Prognose-Symbol im linken Menü aus.
Wählen Sie CRREM und Retrofits.
Stranding-Risiko (CRREM) wird automatisch geöffnet.
Filter
Filter helfen Ihnen, das, was Sie im Bericht sehen, anzupassen. Sie finden sie in der oberen Leiste der Plattform.
1. Portfolio-Filter: Sie können den Umfang der Daten anpassen, indem Sie auswählen:
Regionen, Länder oder Gebäude (basierend auf Geographie oder individueller Struktur).
Gebäudeattribute wie: Typ, Eigentum, Status, Bruttobaufläche (GFA)
2. Gebäude-Dropdown: Wählen Sie bestimmte Gebäude aus, auf die Sie sich konzentrieren möchten.
Nachfolgend finden Sie eine Liste aller verfügbaren Filter für den Stranding-Risiko (CRREM)-Bericht im Filterfeld:
Filter im Filterfeld | Optionen | Beschreibung |
|---|---|---|
Retrofits-Szenario | Nichts unternehmen; Dekarbonisierung | Definieren Sie Ihren strategischen Ansatz zur Dekarbonisierung der Vermögenswerte, indem Sie eine von zwei Optionen wählen: „Nichts tun“, was bedeutet, die aktuelle Leistung beizubehalten, oder „Dekarbonisierung“, was die Umsetzung von Maßnahmen zur Energieeffizienz und Emissionsreduzierung beinhaltet. |
Gebäude mit Retrofit | Alle Gebäude; Gebäude mit Retrofit | Wählen Sie aus, ob die ausgewählten Widgets Daten für alle Gebäude oder nur für diejenigen anzeigen, die Retrofitsmaßnahmen durchlaufen. |
Messart | Absolut; Intensität | Definieren Sie, ob die Erkenntnisse als absolute Werte oder als Intensitätswerte basierend auf dem ausgewählten Referenzbereich berechnet werden. |
Zielpfad | CRREM v1 1.5°C; CRREM v1 2°C; CRREM v2 1.5°C; CRREM v2 2°C; „Individuell“ | Definieren Sie die Reihe von jährlichen Zielen für Emissionen oder Energie bis 2050. Verwenden Sie die vordefinierten CRREM-Pfade oder definieren Sie Ihren eigenen „individuellen“ Pfad zur Dekarbonisierung des Portfolios. |
Datennormalisierung | Keine; Leerstand; Wetter; Wetter und Leerstand | Wenden Sie Normalisierungsoptionen an, um die Datenpräsentation zu standardisieren. |
Berichtsart | Standortbasiert; Marktbasiert | Wählen Sie, ob die Analyse mit standort- oder marktbasierten THG-Emissionen durchgeführt werden soll. |
Plausible Daten | Alle; Nur plausible Daten | Definieren Sie, ob die Erkenntnisse alle Daten oder nur plausible Daten beinhalten. |
Gebäude nach Heizungsart | Wärmepumpe; Erdgas; Fernwärme; Unbestimmt; Ölbasierte Brennstoffe; Biomasse; Geothermie; Solarthermie; Elektrizität (Heizkörper); Mikro-KWK | Definieren Sie, ob die Erkenntnisse alle Verbrauchsdaten oder nur Daten von Gebäuden mit spezifischen Heizungsarten umfassen. |
Visualisierungen und Erkenntnisse
1. Gebäudekennzahlen
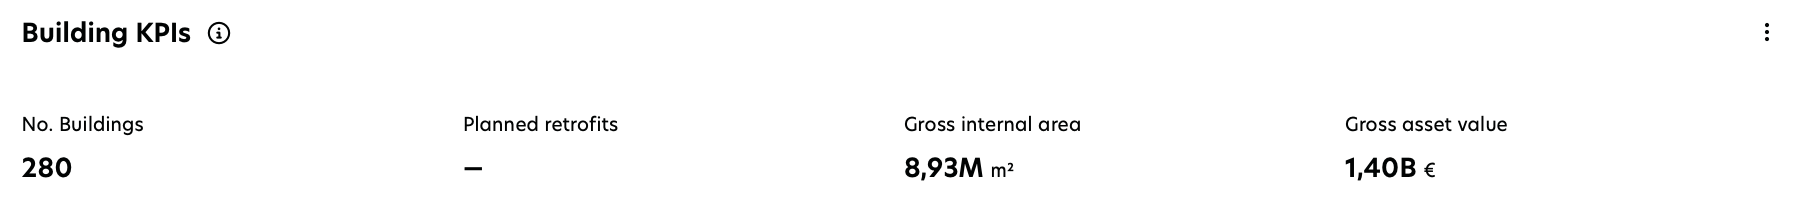
Gebäude KPIs sind sowohl im Szenario „Nichts tun“ als auch im Szenario „Dekarbonisierung“ verfügbar.
Wichtige Leistungsindikatoren (KPIs) im Szenario „Nichts tun“
Anzahl der Gebäude: Anzahl der ausgewählten Gebäude
Geplante Retrofits: Anzahl der geplanten Retrofits innerhalb der Auswahl
Bruttoinnenfläche: Gesamter Bruttoinnenfläche für ausgewählte Gebäude
Bruttovermögenswert: Gesamter Bruttovermögenswert für ausgewählte Gebäude
Wichtige Leistungsindikatoren (KPIs) im Szenario „Dekarbonisierung“
Anzahl der Gebäude mit Retrofits: Anzahl der Gebäude in der Auswahl mit geplanten Retrofit
Geplante Retrofits: Anzahl der geplanten Retrofits innerhalb der Auswahl
Bruttoinnenfläche: Gesamter Bruttoinnenfläche für ausgewählte Gebäude
Bruttovermögenswert: Gesamter Bruttovermögenswert für ausgewählte Gebäude
KPI-Einheiten:
Anzahl der Gebäude (mit Retrofits) | Geplante Retrofits | Bruttofläche | Bruttovermögenswert | |
|---|---|---|---|---|
Absolut | Nicht zutreffend (N/A) | Na | m2 | € |
Intensität | Na | Na | m2 | €/m2 |
2. Voraussichtliche Leistung vs. Ziel
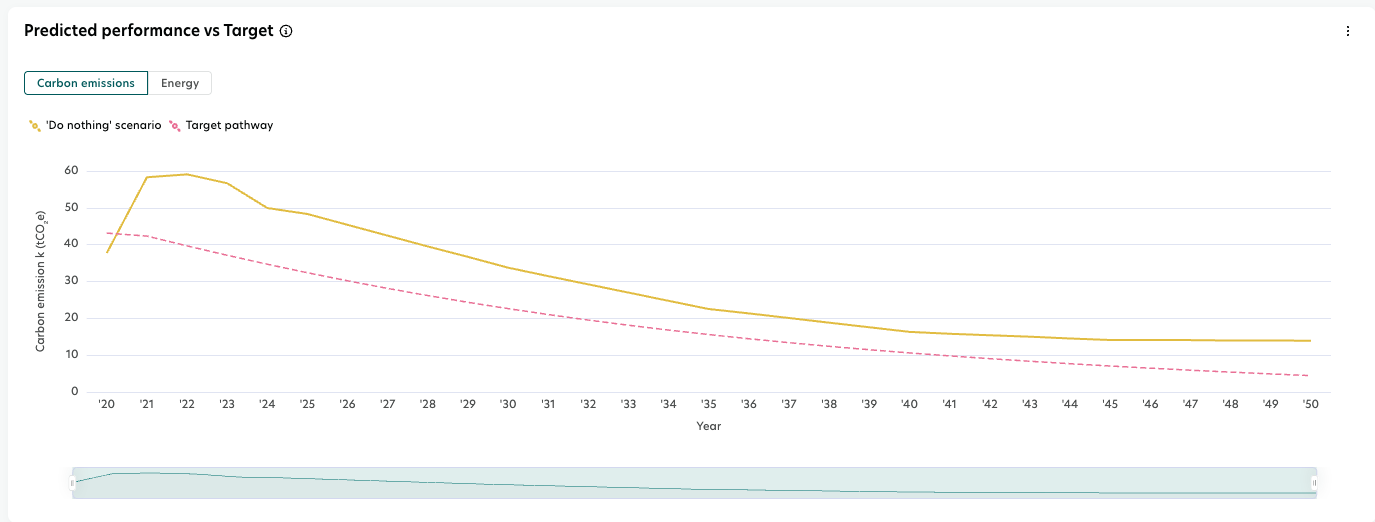
Dieses Diagramm zeigt, wie betriebliche CO₂-Emissionen oder Energieverbrauch/-bedarf im Vergleich zu einem gewählten Zielpfad abschneiden. Es visualisiert zwei Szenarien: die „Nichts tun“-Basislinie und das „Dekarbonisierungs“-Szenario, welches geplante Nachrüstungen beinhaltet, im Vergleich zum gewählten Zielpfad. Jeder Balken repräsentiert die Investitionsausgaben (CapEx) für einzelne Nachrüstungsmaßnahmen im Dekarbonisierungsszenario. Verwenden Sie den Zielpfad-Filter, um aus den vordefinierten CRREM-Versionen auszuwählen oder individuelle Ziele zu erstellen.
3. Anteil der gestrandeten Assets
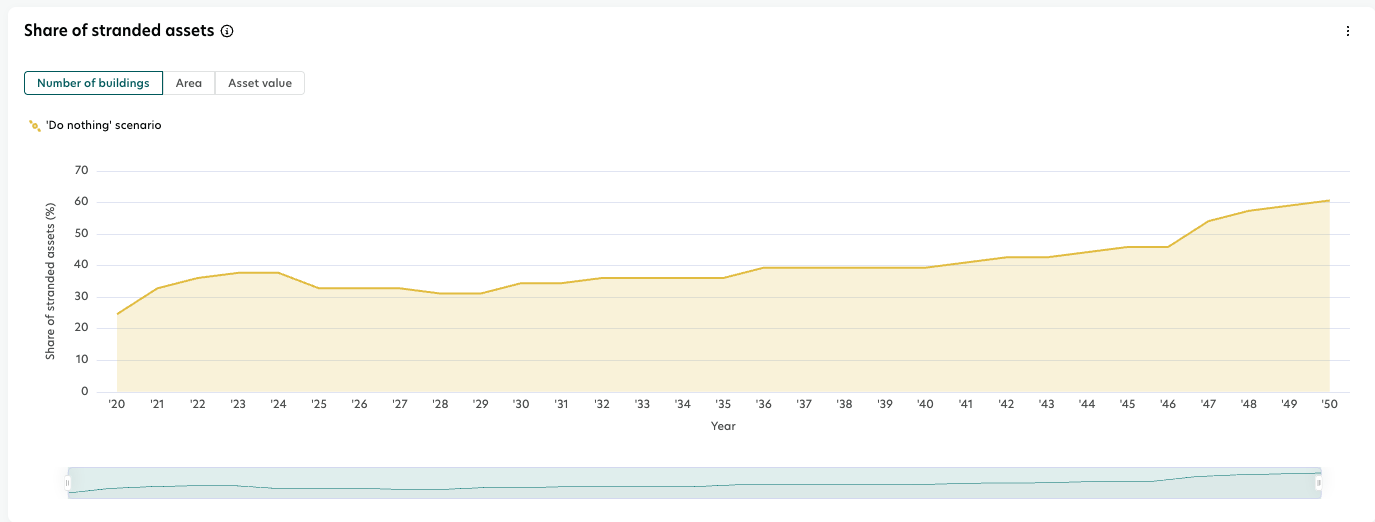
Dieses Diagramm zeigt den Anteil der gestrandeten Vermögenswerte innerhalb der ausgewählten Gebäude oder Portfolios bis 2050, basierend auf drei Kennzahlen: Bruttobaufläche (m²), Anzahl der Gebäude oder Marktwert (€). Verwenden Sie den Schalter, um zwischen Fläche, Anzahl der Gebäude oder Marktwert umzuschalten und den Anteil der gestrandeten Vermögenswerte entsprechend anzuzeigen. Um den spezifischen Anteil für ein bestimmtes Jahr zu sehen, fahren Sie mit der Maus über das Diagramm, um den Prozentsatz zusammen mit dem entsprechenden Kennwert anzuzeigen.
4. Gebäudeeffizienz
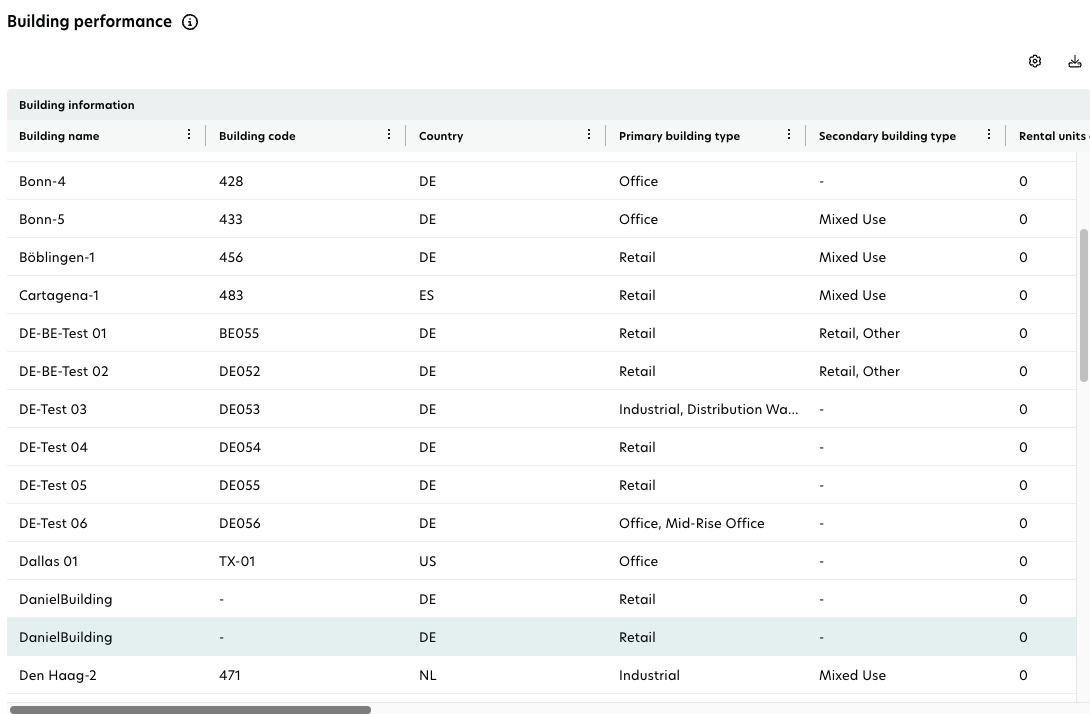
Diese Tabelle zeigt Benchmarking und Portfoliovergleiche und erleichtert die Identifizierung von leistungsstarken und schwach leistungsstarken Gebäuden innerhalb derselben Kategorie.
Wichtige Leistungsindikatoren (KPIs)
Gebäudeinformationen: Zeigt Details wie Gebäudenamen, Gebäude-Code, Land, primären und sekundären Gebäudetyp, verfügbare Mieteinheiten und Bruttobaufläche (m²).
Aktuelles Jahr: Zeigt CO₂-Emissionen (tCO₂e) und CO₂-Ziel (tCO₂e).
Analyse des Stranding-Risikos: Zeigt Jahr des Kohlenstoffstranding, Kohlenstoffstranding nach der letzten Nachrüstung, Anzahl der Jahre nicht stranded, Gesamtemissionen bis 2050 (tCO₂e) und Marktwert (€).
Auswirkungen der Nachrüstung: Zeigt CapEx (€), verkörpertes CO₂ (tCO₂e), Einsparungen der Nachrüstung (tCO₂e) und CapEx pro kgCO₂e-Einsparungen.
Download
Sie können die Daten in der Tabelle in eine CSV- oder Excel-Datei exportieren, indem Sie auf das Download-Symbol in der oberen rechten Ecke klicken und Ihr gewünschtes Format auswählen.