Energieeffizienz-Zertifikate - Bericht
Der Energieeffizienz-Zertifikate - Bericht gibt Einblicke in die Energieeffizienz Ihrer Gebäude. Er hilft dabei, die Einhaltung gesetzlicher Standards wie SFDR und der EU-Taxonomie zu verfolgen, indem er gültige Energieausweise und deren Klassifizierungen anzeigt.
Filter zur Anpassung des Berichts
Um den Energieeffizienz-Zertifikate - Bericht zu steuern, können Sie anwenden:
Gültiges Jahr: Wählen Sie ein zukünftiges Jahr, um die Gültigkeit der Energieausweise zu analysieren.
Zertifikatklassen: Filtern Sie Gebäude nach Energieklasse.
Bezugsgröße (beeinflusst Diagramme und Zusammenfassungsfelder):
Anzahl der Gebäude: Ergebnisse basierend auf der Anzahl der Gebäude anzeigen. Jedes Gebäude wird unabhängig von seiner Größe oder seinem Wert als eine Einheit gewertet.
Energiebezugsfläche: Ergebnisse in Bezug auf die Gesamtfläche (Summe, in m²) anzeigen.
Bruttovermögenswert: Ergebnisse in Bezug auf die Bewertung (in EUR) anzeigen.
Diese Filter gelten für den gesamten Bericht.
Kennzahlen (KPIs)
Vier Diagramme zeigen die KPIs.
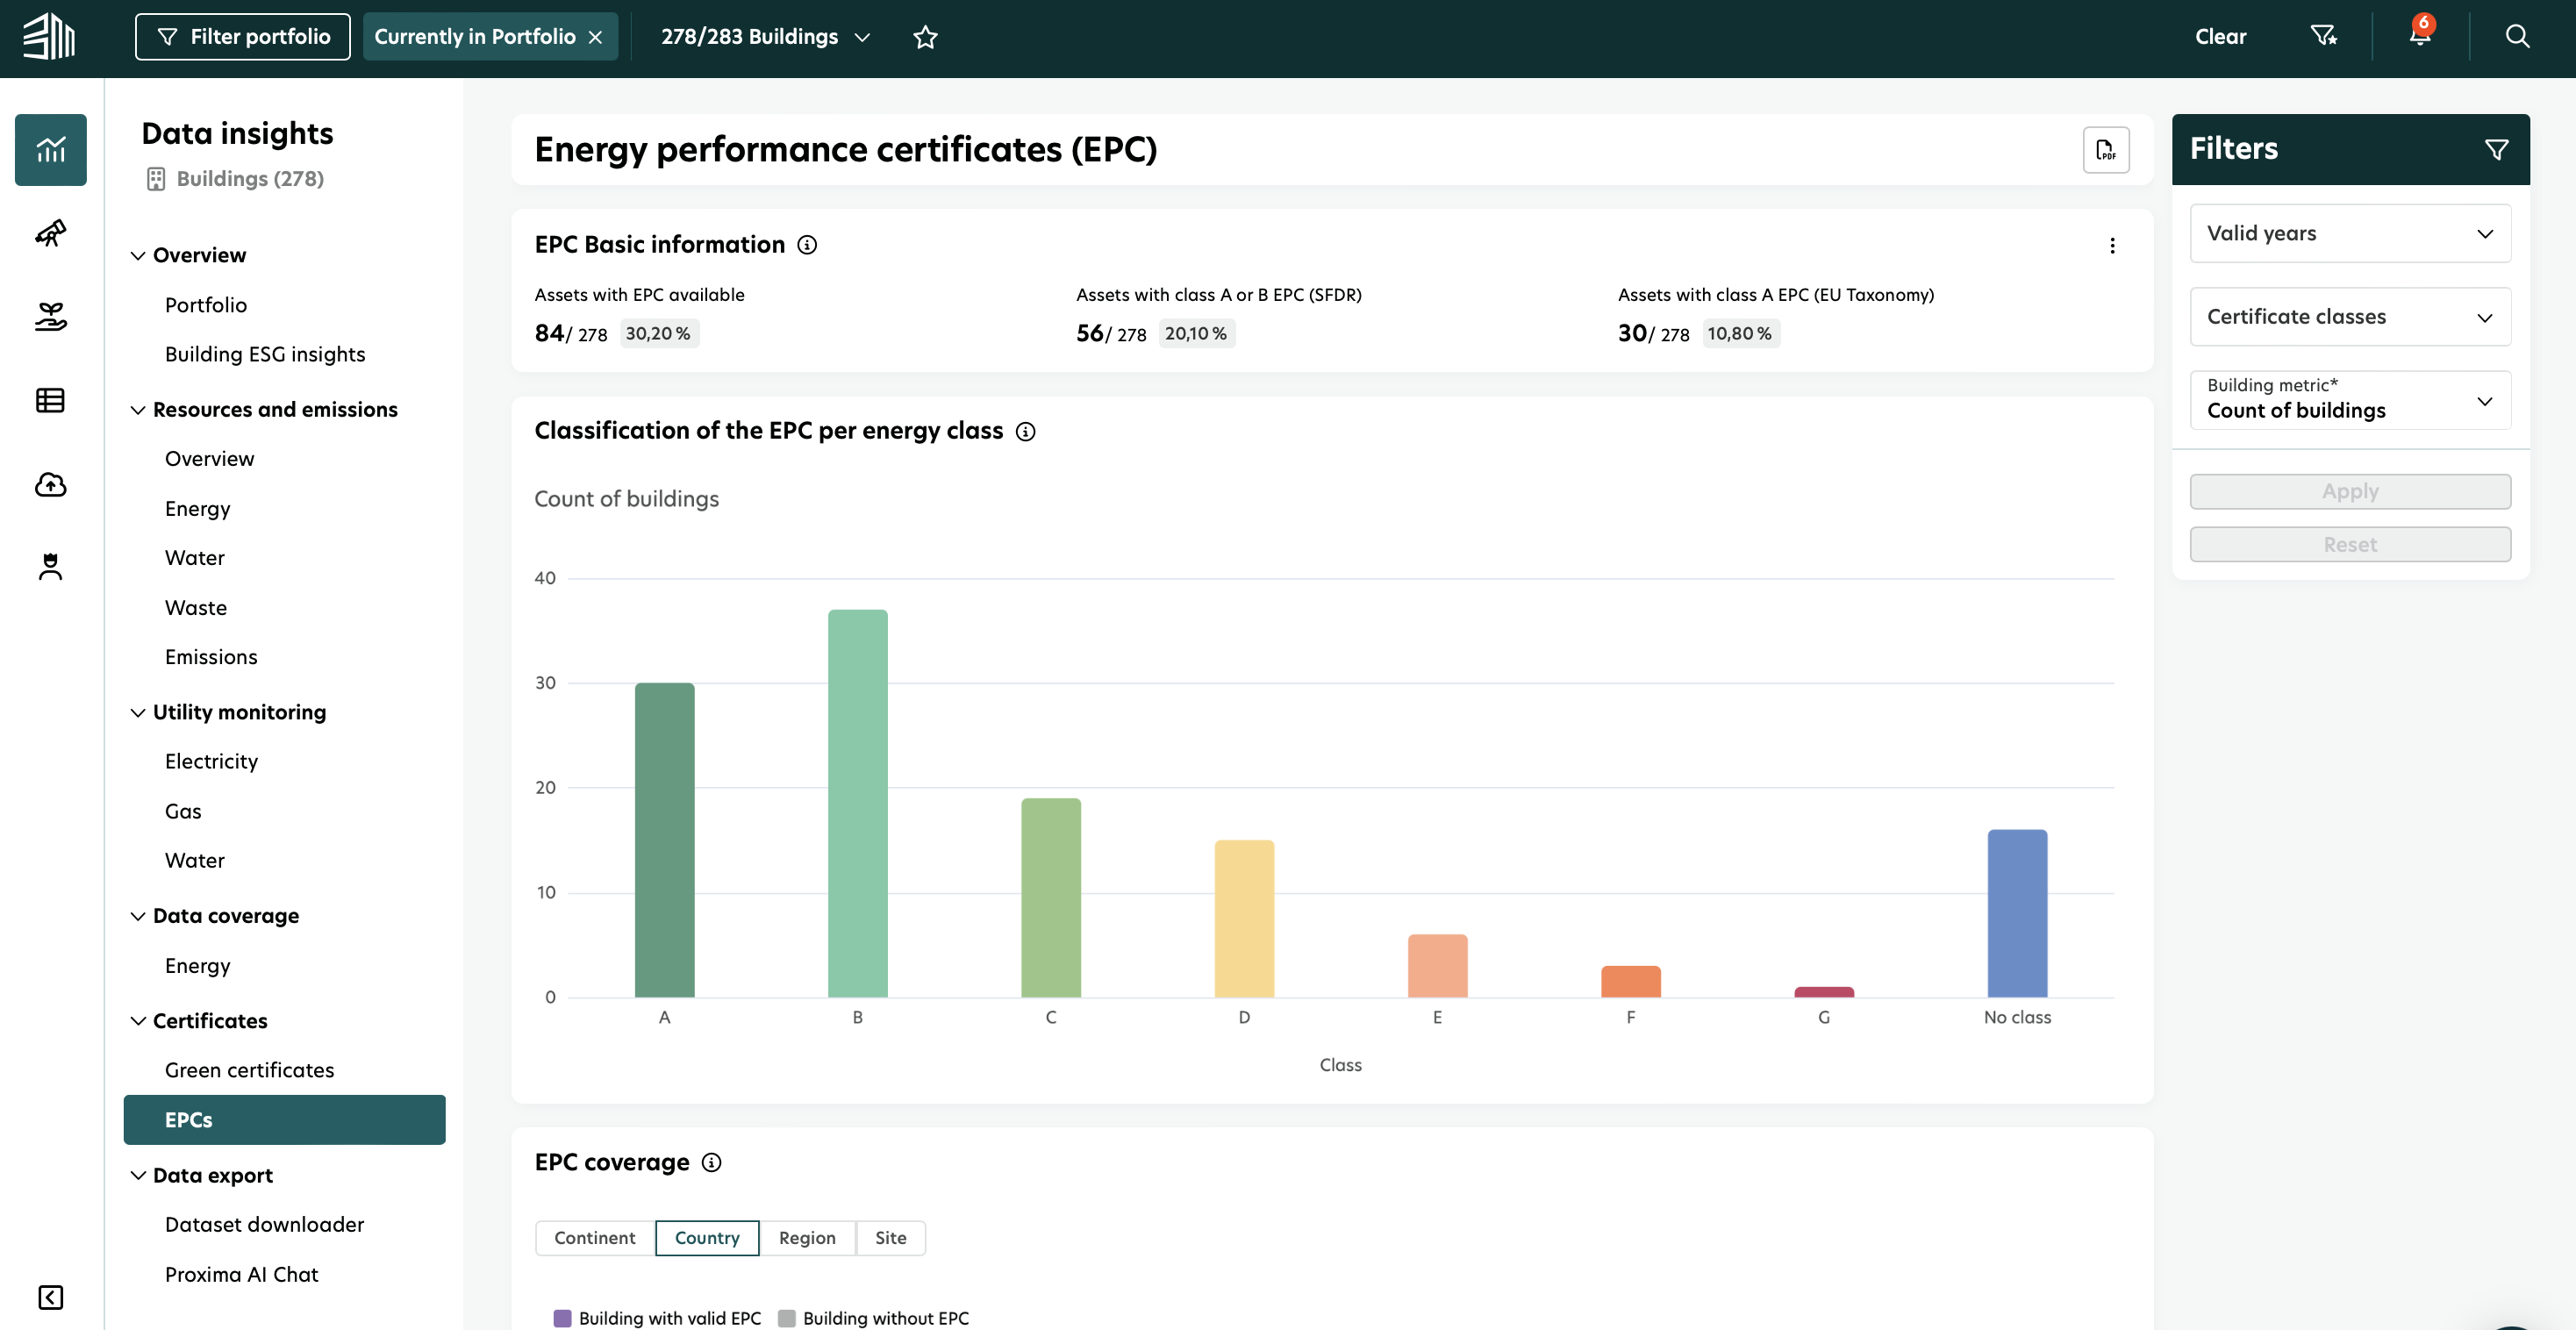
Diagramm 1: Energieausweis - Grundinformationen
Dieses Diagramm zeigt:
Verfügbaren Assets mit Energieausweis: Zeigt den Anteil der gültigen Energieausweisen auf Gebäude- oder Portfolioebene.
Assets mit Klasse A oder B Energieausweis (SFDR): Hebt Gebäude hervor, die den SFDR Vorschriften entsprechen.
Assets mit Klasse A Energieausweis (EU-Taxonomie): Identifiziert Gebäude, die mit der EU-Taxonomie übereinstimmen, ohne zusätzliche Vergleiche.
Hinweis: Diese Daten repräsentieren die Anzahl der Vermögenswerte, nicht die Anzahl der Energieausweise.
Alle oben genannten KPIs bezüglich des Energiebezugsgebiets und des Bruttovermögenswerts werden ebenfalls verfügbar sein.
Dieses Diagramm bietet einen Überblick über die Anzahl der Gebäude mit gültigen Energieausweisen, den Anteil derjenigen mit hohen Energieeffizienzbewertungen (Klasse A oder B gemäß SFDR und Klasse A gemäß EU-Taxonomie) und ihren Anteil im Portfolio.
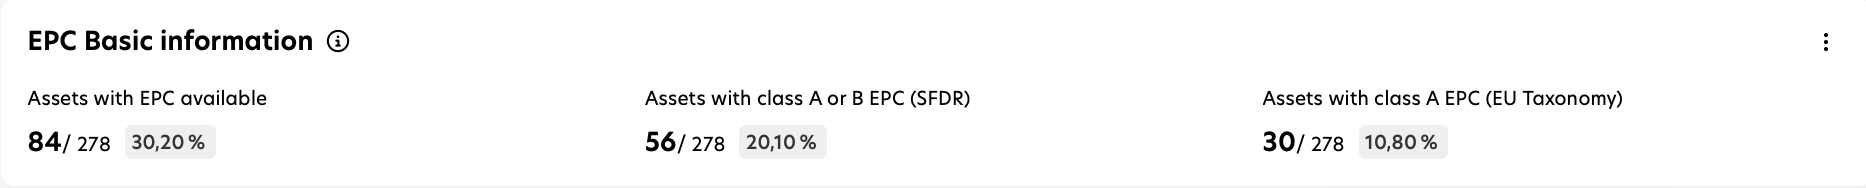
Diagramm 2: Klassifizierung des Energieausweises nach Energieklasse
Dieses Balkendiagramm kategorisiert gültige Energieausweise nach Energieklasse. Wenn Sie über die Balken fahren, können Sie Folgendes ansehen:
Energieklasse
Metrik, die mit dem ausgewählten Filter verbunden ist (z. B. Bruttowert der Vermögenswerte, Anzahl der Gebäude oder Energiebezugfläche)
Gesamtzahl der gültigen Energieausweisen
Dieses Balkendiagramm zeigt die Verteilung der Energieausweisen über verschiedene Energieklassen, sodass Sie bewerten können, wie Ihr Portfolio kategorisiert ist. Die angezeigte Metrik (Marktwert, Gebäudeanzahl oder Energiebezugfläche) ändert sich dynamisch basierend auf dem ausgewählten Filter und bietet flexible Einblicke in die Zusammensetzung des Portfolios.
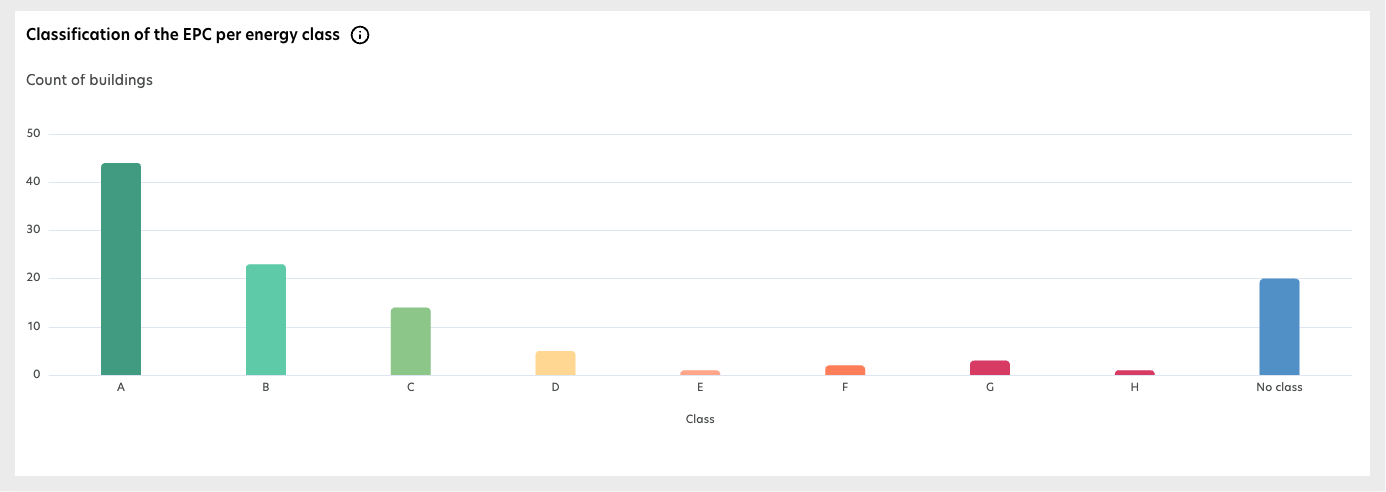
Diagramm 3: Energieausweis-Abdeckung
Dieses Diagramm zeigt die geografische Verteilung von gültigen und fehlenden Energieausweisen über:
Kontinent
Land
Region
Standort
Es visualisiert die Energieausweis-Abdeckung auf verschiedenen geografischen Ebenen und hebt Gebäude mit und ohne gültige Energieausweise hervor, um Zertifizierungslücken zu identifizieren.
Nachhaltigkeits- und Asset-Manager können die Anzahl der Gebäude mit gültigen Energieausweisen auf jeder Ebene sowie den Bruttowert der Vermögenswerte und die von diesen Energieausweisen abgedeckte Energiebezugfläche überprüfen.
Immobilienverwalter können standortspezifische Daten anzeigen und geeignete Maßnahmen ergreifen.
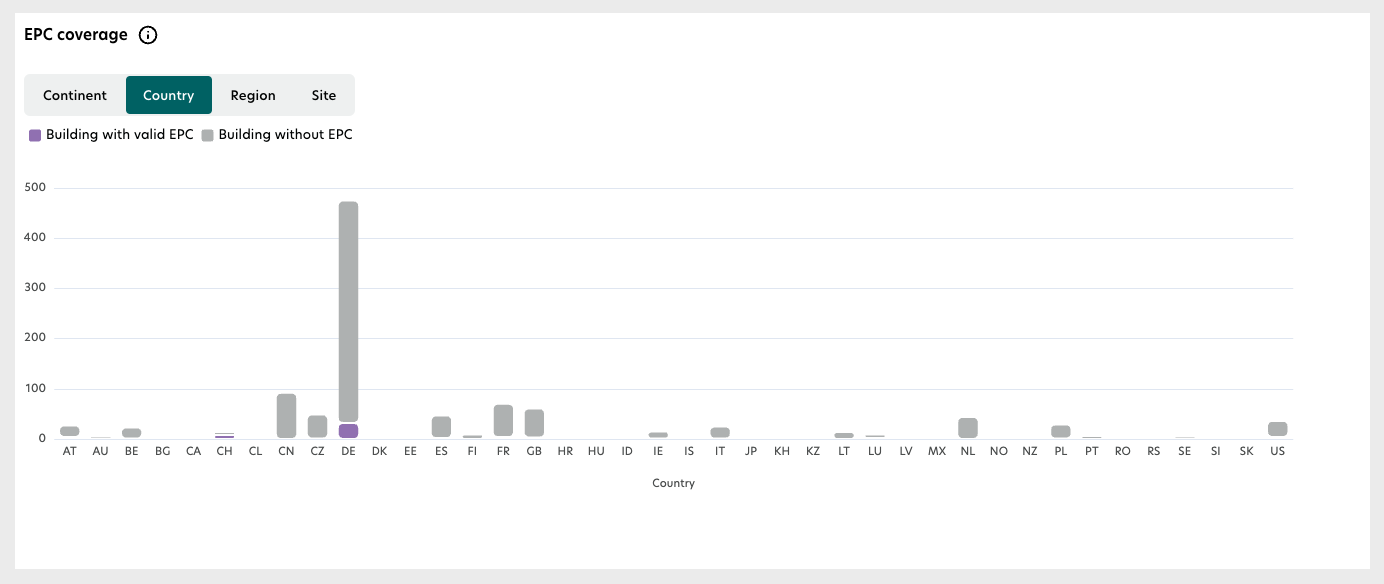
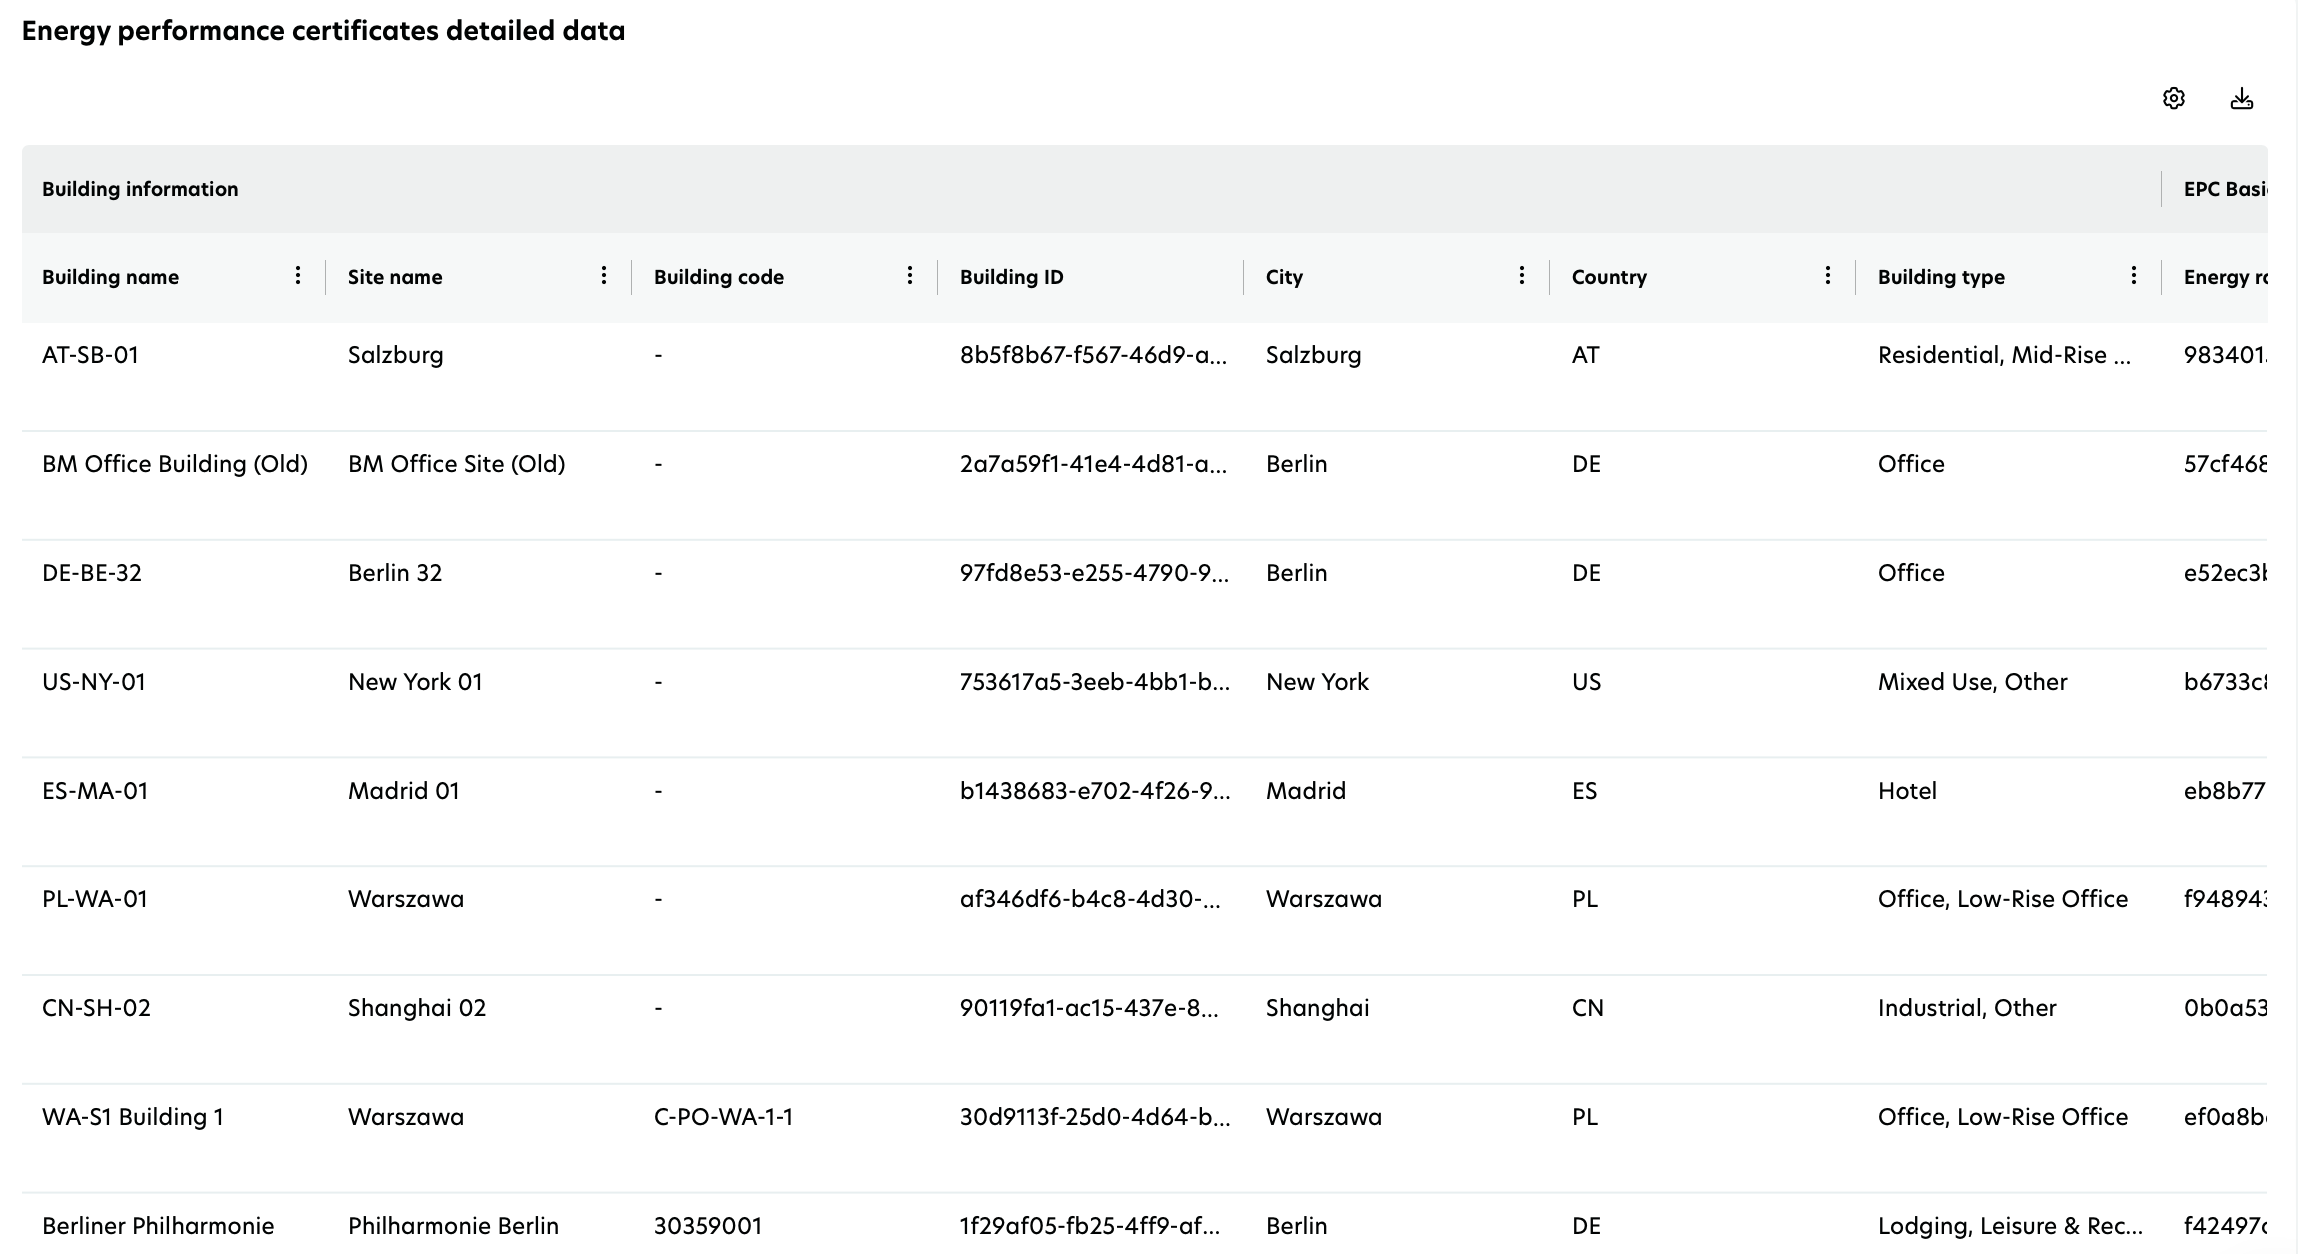
Diagramm 4: Detaillierte Daten über die Energieeffizienz-Zertifikate
Diese detaillierte Aufschlüsselungstabelle bietet herunterladbare .CSV- oder .XLS-Dateien mit:
Gebäude- und Standortdetails: Name, Code, Stadt und Immobilientyp.
EPC-Spezifika: Energieklasse, Gültigkeitsdatum und Status.
Energiebezogene Kennzahlen: Endenergie, Primärenergie und NZEB-Status.
Anpassungsoptionen: Spalten nach Bedarf erweitern, ausblenden oder sortieren.
Die Tabelle bietet eine umfassende Liste von Energieausweis-Details, einschließlich Energieklasse, Gültigkeit und energetischen Leistungskennzahlen. Sie können diese Daten für weiterführende Analysen und Berichterstattung herunterladen.