SFDR-Bericht
Der SFDR-Bericht gibt Ihnen einen klaren Überblick über Nachhaltigkeitsrisiken und wesentliche nachteilige Auswirkungen (PAI)-Indikatoren für Ihr Immobilienportfolio, wie es die EU-Verordnung über nachhaltige Finanzberichterstattung verlangt. Mit dieser Funktion können Sie diese Anforderungen leicht erfüllen, indem Sie Daten zur Exponierung gegenüber fossilen Brennstoffen, zur operativen Leistung und zu Bewertungskennzahlen - sowohl für einzelne Gebäude als auch für Ihr gesamtes Portfolio - aggregieren und präsentieren.
Zugriff auf den Bericht
Wählen Sie ESG-Berichte aus dem linken Menü aus.
Wählen Sie SFDR aus, um auf den Bericht zuzugreifen.
Filter im Bericht
Sie können die im Bericht angezeigten Daten mit den Filtern in der oberen Leiste der Plattform anpassen.
1. Portfoliofilter
Verwenden Sie diesen Filter, um auszuwählen, welchen Teil Ihres Portfolios Sie analysieren möchten.
Sie können wählen:
Regionen, Länder oder Gebäude (basierend auf Geografie oder benutzerdefinierter Struktur)
Gebäudeeigenschaften wie Typ, Eigentum oder Status
2. Dropdown-Menü Gebäude
Verwenden Sie dieses Dropdown-Menü, um ein oder mehrere Gebäude für eine detaillierte Analyse auszuwählen.
3. Filterbereich
Sie können die folgenden Filter verwenden, um die im Bericht angezeigten Daten anzupassen:
Filter im Filterbereich | Optionen | Beschreibung |
|---|---|---|
Startdatum | 2020, 2021, 2022 und andere relevante Jahre | Wählen Sie das Anfangsjahr aus, für das Sie die Daten im Dashboard anzeigen möchten. |
Startquartal | Q1-Q4, Q2-Q1, Q3-Q2, Q4-Q3 | Die SFDR-Berichterstattung basiert auf der quartalsweisen Datenaggregation, sodass Sie spezifische Kombinationen von Quartalen auswählen können, die im Dashboard angezeigt werden sollen. Dies erleichtert die Analyse von Daten für Fonds mit unterschiedlichen Beginn der Geschäftsjahre, da das erste Quartal von einem Fonds zum anderen unterschiedlich sein kann. |
Jahr | 1, 2, 3, 4 oder 5 | Wählen Sie, wie viele Jahre an Daten im Balkendiagramm und in der Tabelle angezeigt werden sollen, beginnend von Ihrem ausgewählten Startdatum. Sie können zwischen 1 und 5 Jahren zur Vergleichsauswahl wählen. |
Metrik anzeigen | Brutto-Marktwert (GAV), Fläche, Vermögenswerte (Gebäude) | Die Ergebnisse können in Bezug auf GAV (in EUR), Gesamtfläche (Summe) oder Gebäudeanzahl angezeigt werden. Bitte beachten Sie, dass die Ergebnisse von PAI 18-2 (THG-Emissionen) und PAI 19 (Energieintensität) nicht von diesem Filter zur Anzeige-Metrik beeinflusst werden. |
Visualisierungen und Erkenntnisse
1. Top-KPIs
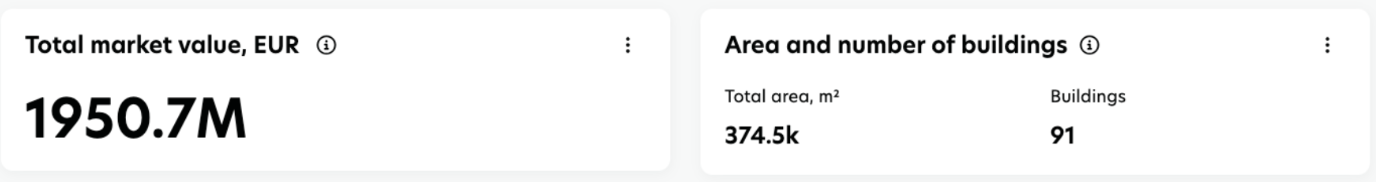
Kernleistungsindikatoren (KPIs)
Gesamtmarktwert: Gesamtbewertung (z.B. Marktwert, GAV, abhängig von den verfügbaren Daten) der ausgewählten Gebäude.
Gesamtfläche: Gesamtenergiebereich (ERA) der ausgewählten Gebäude.
Gebäude: Anzahl der ausgewählten Gebäude.
Die wichtigsten KPIs reagieren auf den Berichtsfilter. Wenn mehrere Jahre ausgewählt sind, wird der Wert für das letzte Jahr angezeigt.
2. Balkendiagramm-Komponente für jedes PAI
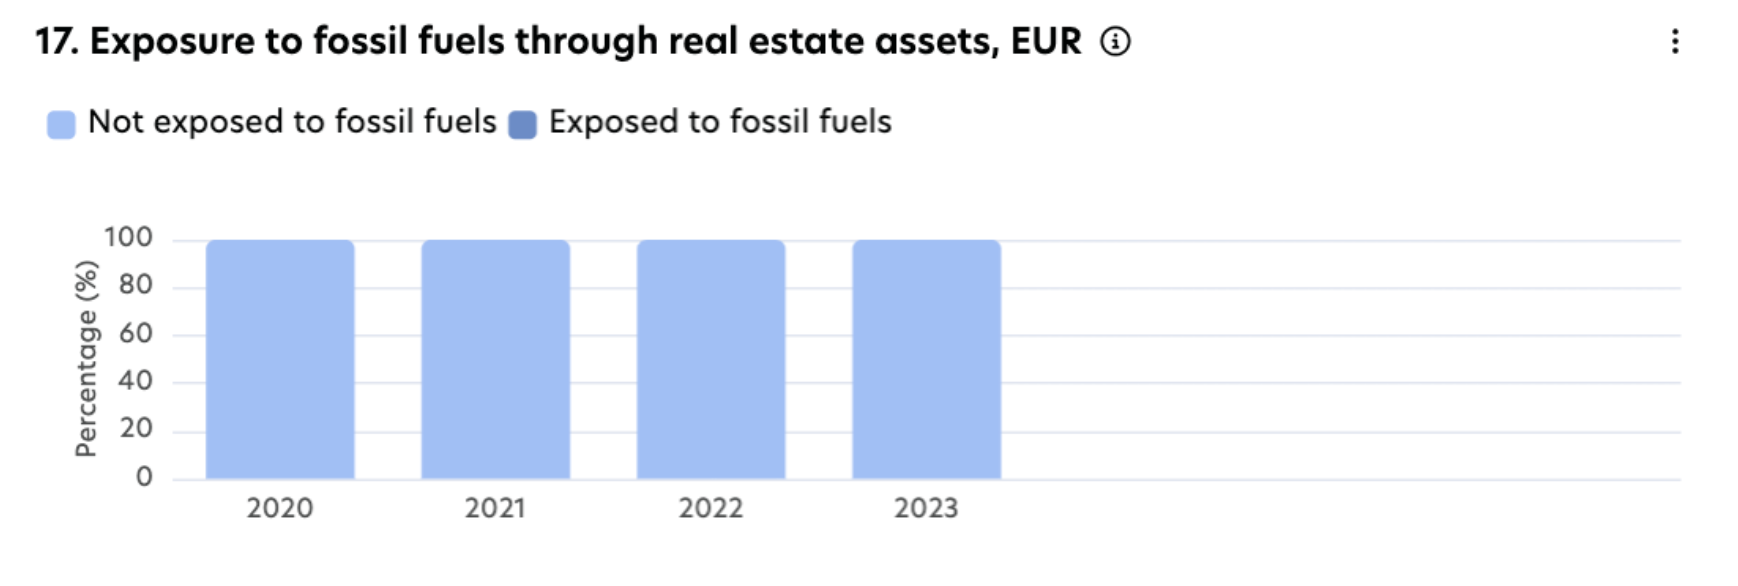
Die Diagrammkomponente des SFDR-Dashboards zeigt jedes PAI und seinen historischen Trend in einem Balkendiagramm an. Was Sie sehen, hängt von der Anzeige-Metrik ab, die Sie im Bericht-Filter wählen (z.B. GAV, Fläche oder Vermögenswerte).
Die Ergebnisse von PAI 18-2 (THG-Emissionen) und PAI 19 (Energieintensität) werden durch diesen Anzeige-Metrikfilter nicht beeinflusst.
Kernleistungsindikatoren (KPIs)
PAI 17: % der Exposition gegenüber fossilen Brennstoffen im Vergleich zu % nicht exponiert.
PAI 18: % energieineffiziente Vermögenswerte im Vergleich zu % effizienten.
PAI 18-2: absoluter Wert der gesamten THG-Emissionen in kg CO₂eq.
PAI 19: absoluter Wert der Energieverbrauchsintensität in kWh/m² und fehlende Daten.
PAI 22: % unbepflanztes Land im Vergleich zu % bepflanztem Land.
3. Tabellenkomponente für jedes PAI
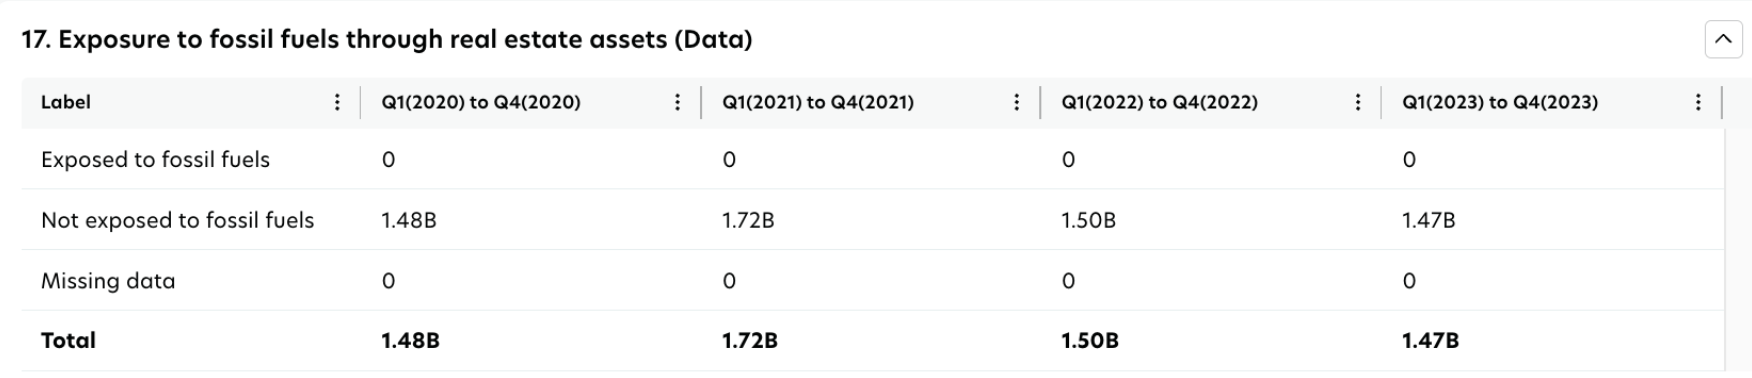
Die Tabellenkomponente erweitert die Diagrammkomponente und zeigt die Informationen in tabellarischer Form an. Was Sie sehen, hängt von der Anzeige-Metrik ab, die Sie auswählen (z.B. GAV, Fläche oder Vermögenswerte).
Die Ergebnisse von PAI 18-2 (Treibhausgasemissionen) und PAI 19 (Energieintensität) sind von diesem Anzeigemetrikfilter nicht betroffen.
Kernleistungsindikatoren (KPIs)
PAI 17: exponiert gegenüber fossilen Brennstoffen, nicht exponiert gegenüber fossilen Brennstoffen und fehlende Daten.
PAI 18: effizient, ineffizient und nicht gemeldet.
PAI 18-2: absoluter Wert der THG-Emissionen Umfang 1, Umfang 2, Umfang 3, unbestimmter Umfang in kg CO₂eq. und fehlende Daten.
PAI 19: absoluter Wert der Energieverbrauchsintensität in kWh/m² und fehlende Daten.
PAI 22: % bepflanztes Land, % unbepflanztes Land und fehlende Daten.
Wichtige Hinweise:
PAI 17 verwendet ENUM 'NOT EXPOSED' nicht und wird bei der Berechnung ignoriert. Mindestanforderung an Daten:
Wenn das Gebäude exponiert ist, sind zwei Bewertungszeilen erforderlich:
Gesamt-GAV (verwenden Sie Exposure ENUM "null / -").
Exponierter GAV (verwenden Sie einen der folgenden Exposure ENUMs: Gewinnung, Transport, Sonstiges, Lagerung, Herstellung).
Wenn das Gebäude vollständig nicht exponiert ist, ist nur eine Bewertungszeile erforderlich:
Gesamt-GAV (verwenden Sie Exposure ENUM "null / -").
Fehlende Daten zeigen an, dass für das Gebäude unvollständige Informationen vorliegen, die erforderlich sind, damit das Dashboard KPIs berechnen kann. Häufige Gründe für fehlende Daten sind (aber nicht beschränkt auf):
PAI 17: keine Gebäudebewertungsdaten verfügbar.
PAI 18: kein gültiger Energieausweis verfügbar.
PAI 18-2: keine Daten zum Ressourcenverbrauch (z.B. Strom, Erdgas) verfügbar.
PAI 19: keine Brutto-Innenfläche (GIA) oder Ressourcenverbrauch (z.B. Strom, Erdgas) Daten verfügbar.
PAI 22: keine Gesamtfläche, bepflanzte Fläche oder unbepflanzte Flächendaten verfügbar.
Nicht gemeldet in PAI 18: zeigt Vermögenswerte in Ländern an, in denen kein spezifischer EPC-Standard existiert.
4. Datenabdeckungs-Komponente für jedes PAI

Das Widget zur Datenabdeckung hilft Ihnen zu verstehen, wie vollständig Ihre Portfoliodaten für jedes PAI sind. Jedes PAI verwendet eigene Abdeckungsmetriken, die unabhängig voneinander funktionieren.
Dieses Widget ändert sich nicht basierend auf der Anzeige-Metrik, die Sie im BerichtsfFilter auswählen.
Kernleistungsindikatoren (KPIs)
PAI 17: tatsächliche und fehlende Daten.
PAI 18: tatsächliche, geschätzte und fehlende Daten.
PAI 18-2: tatsächliche, extrapolierte, geschätzte, unbestimmte und fehlende Daten.
PAI 19: tatsächliche, extrapolierte, geschätzte, unbestimmte und fehlende Daten.
PAI 22: tatsächliche und fehlende Daten.
5. Detaillierte Aufschlüsselung
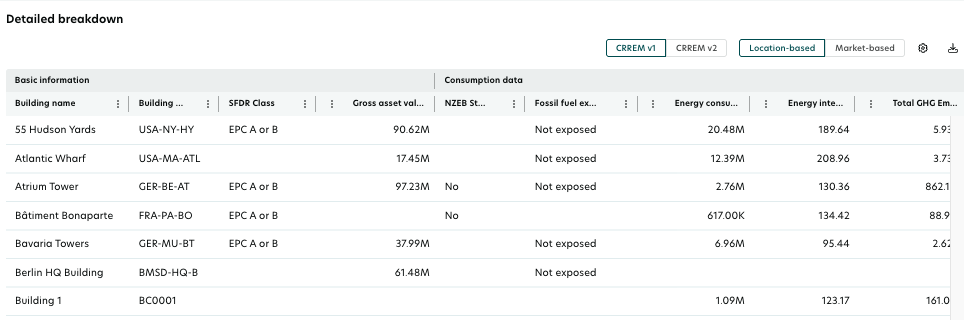
Die detaillierte Aufschlüsselungstabelle bietet alle wichtigen KPIs, die für die PAI-Berichterstattung erforderlich sind. Standardmäßig werden die Daten für das aktuellste Jahr angezeigt. Um ein bestimmtes Jahr anzuzeigen, wählen Sie es mithilfe der Filteroptionen aus. Wenn mehrere Jahre ausgewählt sind, zeigt die detaillierte Aufschlüsselung das aktuellste Jahr aus der Auswahl an.
Die detaillierte Aufschlüsselung umfasst:
Gebäudeinformationen
Exposition gegenüber fossilen Brennstoffen
EPC-Daten
Daten zum Energieverbrauch und zur Energieintensität
THG-Emissionsdaten
Landkünstlichmachung
Außerdem sind spezifische lokale Filter zu PAI 18-2 innerhalb der detaillierten Aufschlüsselungsstruktur verfügbar.
Herunterladen: Sie können die Tabellendaten durch Klicken auf das Download-Symbol über der Tabelle und Auswählen des gewünschten Formats in eine CSV- oder Excel-Datei exportieren.