EU-Taxonomiebericht
Der EU-Taxonomiebericht hilft Ihnen, den Abstimmungsstatus Ihrer Vermögenswerte mit den Anforderungen der EU-Taxonomie nachzuvollziehen und zu verstehen. Er bietet klare Visualisierungen, die zeigen, ob die wirtschaftlichen Aktivitäten in Ihrem Portfolio mit Umweltzielen wie der Minderung der Auswirkungen des Klimawandels und der Anpassung an den Klimawandel übereinstimmen und sowohl die Kriterien für erhebliche Beiträge (SC) als auch für das Verursachen von keinen erheblichen Schäden (DNSH) abdecken. Der Abstimmungsstatus wird im EU-Taxonomie-Tool anhand Ihrer Antworten auf die EU-Taxonomie-Kriterien und Datenanforderungen (z. B. Erfüllung bestimmter EPC-Klassen oder Anforderungen an den Primärenergiebedarf) berechnet.
Zugriff auf den Bericht
Wählen Sie ESG-Berichte aus dem Menü auf der linken Seite.
Unter EU-Taxonomie klicken Sie auf Bericht, um auf den entsprechenden Bericht zuzugreifen.
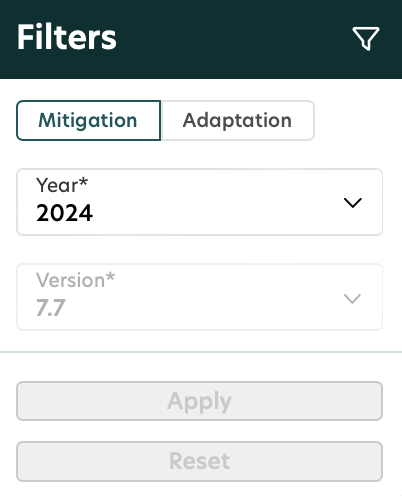
Filter im Bericht
Sie können anpassen, welche Daten im Bericht angezeigt werden, indem Sie Filter in der oberen Leiste der Plattform verwenden.
1. Portfoliofilter
Verwenden Sie diesen Filter, um auszuwählen, welchen Teil Ihres Portfolios Sie analysieren möchten.
Sie können wählen:
Regionen, Länder oder Gebäude (basierend auf Geografie oder benutzerdefinierter Struktur)
Gebäudeattribute wie Typ, Eigentum oder Status
2. Gebäude-Dropdown
Verwenden Sie dieses Dropdown, um ein oder mehrere Gebäude für eine detaillierte Analyse auszuwählen.
3. Filterpanel
Sie können die folgenden Filter verwenden, um anzupassen, welche Daten im Bericht angezeigt werden:
Filter im Filterpanel | Optionen | Beschreibung |
|---|---|---|
Oben umschalten | Klimaschutz; Anpassung | Wählen Sie das spezifische Umweltziel der EU-Taxonomie aus, das Sie im Dashboard anzeigen möchten. |
Jahr | 2023, 2024, 2025 und andere anwendbare Jahre | Wählen Sie das Jahr der gemeldeten Daten aus, das Sie im Dashboard anzeigen möchten. |
Version | 7.7 | Wählen Sie die Aktivität der EU-Taxonomie aus, die Sie im Dashboard anzeigen möchten. Wenn zusätzliche Aktivitäten verfügbar werden, erscheinen sie in diesem Dropdown-Menü. |
Visualisierungen und Einblicke
1. Übersicht
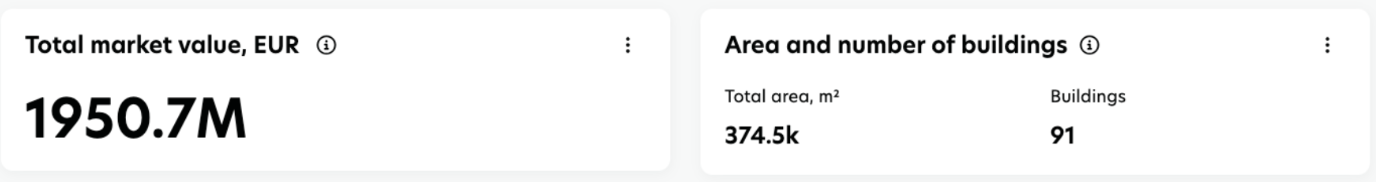
Wichtige Leistungsindikatoren (KPIs)
Bruttowert der Vermögenswerte: Dies zeigt die Bewertung von Gebäuden, die vollständig mit beiden Unterzielen der EU-Taxonomie übereinstimmen: Erheblicher Beitrag (SC) und Verursachen von keinen erheblichen Schäden (DNSH). Der Nenner stellt die Gesamtbewertung des ausgewählten Portfolios oder der Gebäude dar.
Vermögenswerte (Gebäude): Dies zeigt die Anzahl der Gebäude, die vollständig mit beiden Unterzielen der EU-Taxonomie übereinstimmen: Substantial Contribution (SC) und Do No Significant Harm (DNSH). Der Nenner stellt die Gesamtzahl der ausgewählten Portfolios oder Gebäude dar.
Fläche: Dies zeigt die Bruttobaufläche (GFA) der Gebäude, die vollständig mit beiden Unterzielen der EU-Taxonomie übereinstimmen: Substantial Contribution (SC) und Do No Significant Harm (DNSH). Der Nenner stellt die gesamte GFA des ausgewählten Portfolios oder der Gebäude dar.
Um den Wert der wichtigsten KPIs zu berechnen, ist eine Bewertung erforderlich. Wenn keine Bewertung verfügbar ist, zeigt das Diagramm 0 an.
Ein Vermögenswert wird unter der EU-Taxonomie nur dann als ausgerichtet betrachtet, wenn er die Anforderungen für beide Teilziele erfüllt: Erheblicher Beitrag (SC) und Vermeidung erheblicher Beeinträchtigungen (DNSH).
Beispiel: Gebäude A hat eine Bewertung von 100.000 EUR. Wenn Gebäude A zu 100 % mit SC und zu 50 % mit DNSH ausgerichtet ist, beträgt der resultierende Ausgerichtete GAV 50.000 EUR.
2. Donut-Diagramme
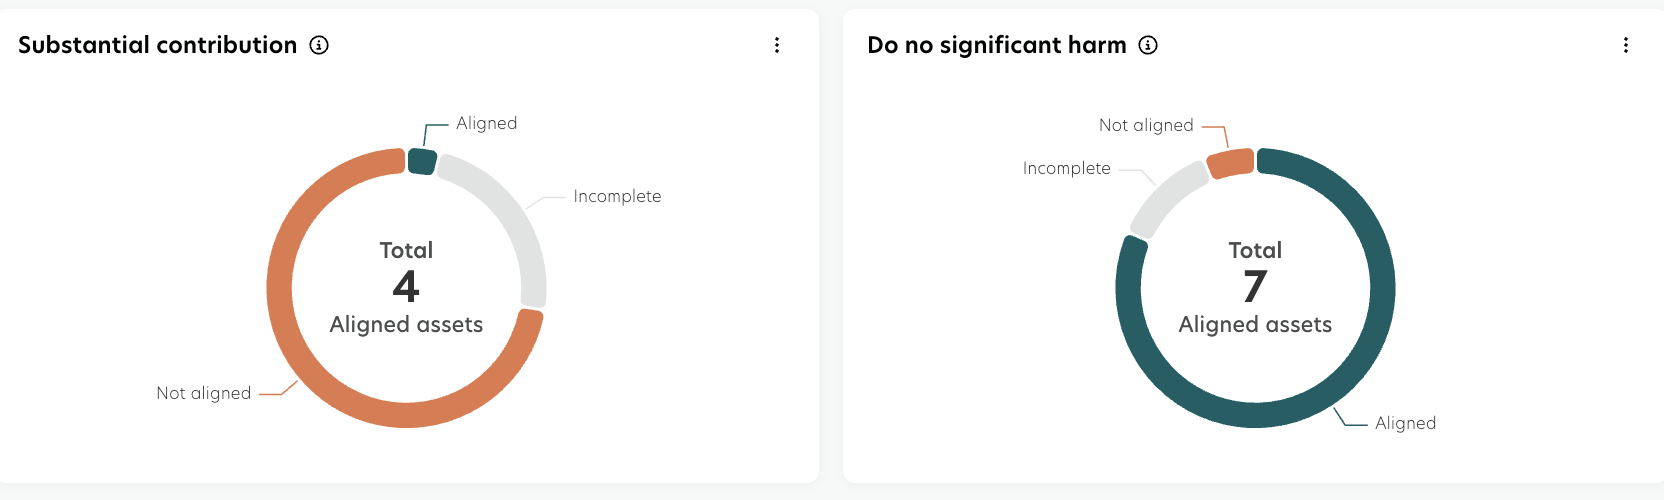
Diese Diagramme bieten eine visuelle Zusammenfassung, wie Ihre bewerteten Vermögenswerte mit den Unterzielen der EU-Taxonomie übereinstimmen: Erheblicher Beitrag (SC) und Verursachen von keinen erheblichen Schäden (DNSH). Jedes Donut-Diagramm zeigt die Verteilung des Bruttowerts der Vermögenswerte (GAV) über verschiedene Abstimmungsstatus.
Die farbigen Segmente stellen den Anteil des GAV für jede Statuskategorie dar.
Die Zahl in der Mitte zeigt die Gesamtzahl der vollständig (100%) und teilweise (>0%) ausgerichteten Vermögenswerte an, die die jeweiligen Teilziele erfüllt haben – was bedeutet, dass sie alle erforderlichen Kriterien für dieses Teilziel erfüllt haben.
Die Gesamtzahl der Vermögenswerte umfasst alle ausgerichteten Vermögenswerte, unabhängig davon, ob sie eine Bewertung haben oder nicht. Zum Beispiel zeigt die Zählung trotz der Tatsache, dass nur ein Vermögenswert einen GAV (Bruttovermögenswert) hat, immer noch zwei Vermögenswerte an.
Statuskategorien
Übereinstimmend: Gibt an, dass das Asset alle Anforderungen für das EU-Taxonomie-Unterziel (SC oder DNSH) erfüllt.
Nicht übereinstimmend: Bezeichnet, dass das Asset nicht alle Anforderungen für das EU-Taxonomie-Unterziel (SC oder DNSH) erfüllt.
Übereinstimmung ausstehend Beweise: Gibt an, dass das Vermögen als 'übereinstimmend' gekennzeichnet werden könnte, sobald Sie die erforderlichen unterstützenden Beweise bereitstellen.
Unvollständig: Gibt an, dass die Bewertung des Vermögenswerts noch unvollständig ist und weitere Schritte erforderlich sind, um den endgültigen Status zu bestimmen.
Um den im Donut-Diagramm angezeigten Wert zu berechnen, ist eine Bewertung erforderlich. Wenn keine Bewertung vorliegt, zeigt das Diagramm 0 an und erscheint in grau.
Ein Gebäude muss 100% ausgerichtet sein, um als ausgerichtete Anlage in den Diagrammen gezählt zu werden. Wenn keine Bewertung für eines der Gebäude durchgeführt wurde, zeigt das Diagramm „Keine Daten“ an.
3. Datenabdeckung
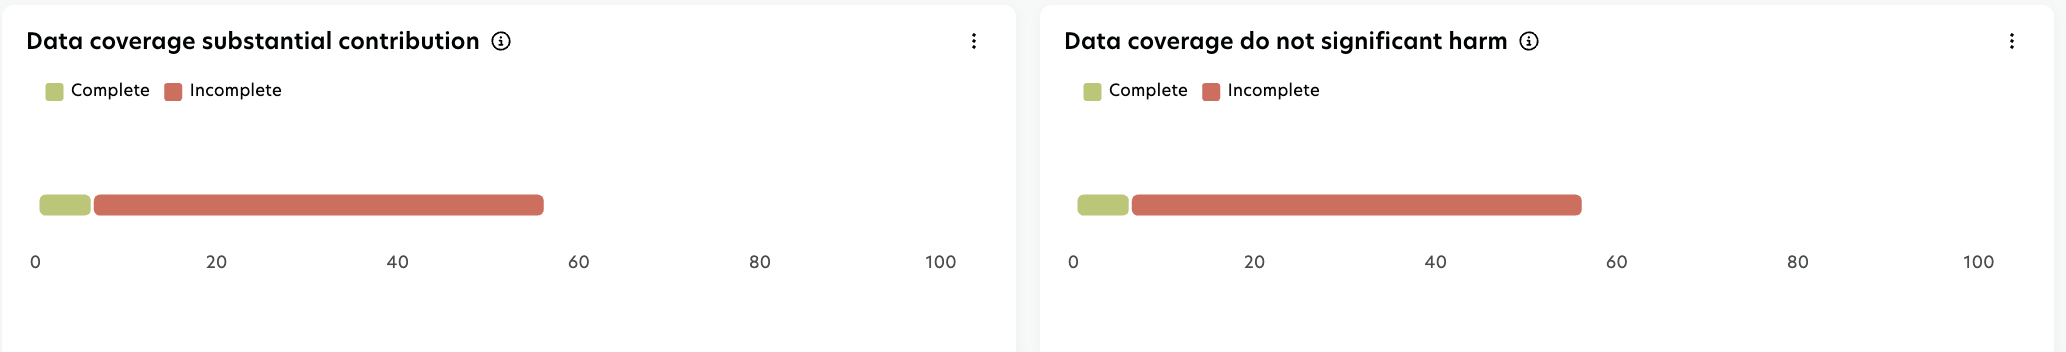
Das Widget zur Datenabdeckung hilft Ihnen, die Vollständigkeit Ihrer Portfoliodaten zu bewerten, indem es den gesamten Fortschritt der Bewertungen zeigt, gemessen an der Anzahl der bewerteten Gebäude.
Der Status Vollständig umfasst alle Vermögenswerte, für die eine Bewertung durchgeführt wurde, unabhängig von den Ergebnissen. Diese Kategorie umfasst:
Ausrichtet: Vermögenswerte, die die Kriterien der EU-Taxonomie vollständig erfüllen.
Nicht ausgerichtet: Vermögenswerte, die die Kriterien für die Ausrichtung nicht erfüllen.
Ausrichtung ausstehend: Vermögenswerte, bei denen die Bewertung eine Ausrichtung anzeigt, aber unterstützende Dokumentationen noch erforderlich sind.
Im Gegensatz dazu bezieht sich der Status Unvollständig auf Vermögenswerte, für die der Bewertungsprozess nicht abgeschlossen wurde. Dazu gehören:
Unvollständig: Vermögenswerte, bei denen Daten teilweise verfügbar oder in Überprüfung sind.
Vermögenswerte ohne Bericht: Vermögenswerte, bei denen keine Bewertung initiiert wurde.
Diese Klassifizierung ermöglicht es Ihnen, effizient zwischen Vermögenswerten mit endgültigen Bewertungsergebnissen und solchen zu unterscheiden, die zusätzliches Eingabe oder Analyse benötigen.
Um den Wert im Daten abdeckungsdiagramm zu berechnen, ist eine Bewertung nicht erforderlich. Das System überprüft nur, ob ein Formular erstellt wurde oder nicht.
4. Detaillierte Aufschlüsselung
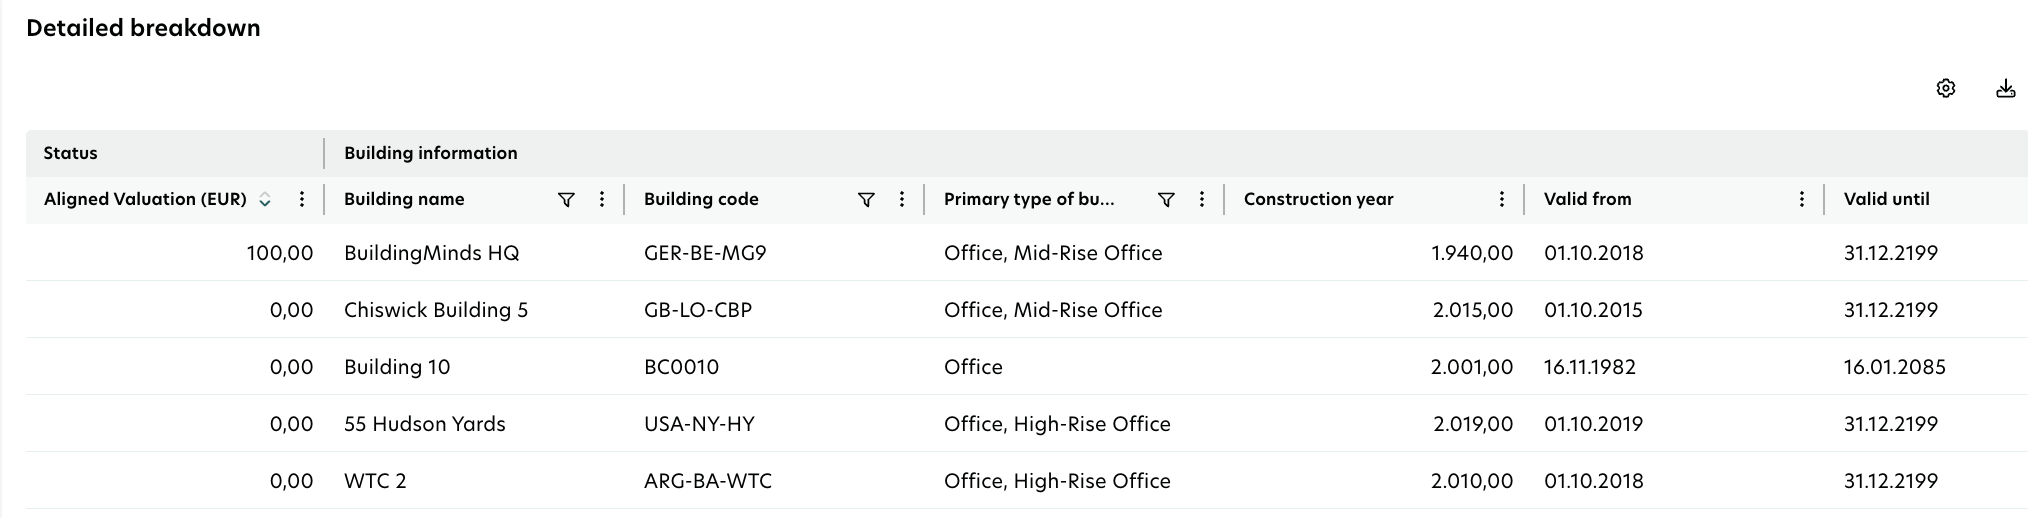
Die detaillierte Aufschlüsselung bietet eine umfassende, aufgeschlüsselte Ansicht jedes Gebäudes in Ihrem Portfolio. Diese dynamische Tabelle passt sich an Ihre aktuelle Navigation oder angewandte Filter an, sodass nur die relevantesten Eigenschaften und zugehörigen Daten angezeigt werden.
Die Tabelle ist in verschiedene Kategorien organisiert, um die Analyse zu erleichtern:
Taxonomie-Status: Zeigt den EU-Taxonomie-Zustand jedes Gebäudes an.
Gebäudeinformationen: Bietet wichtige Details über das Gebäude, wie Name und Standort.
Unterteilung Substantial Contribution: Hebt den Übereinstimmungsstatus mit den Kriterien der Substantial Contribution (SC) hervor.
DNSH-Unterteilung: Gibt die Einhaltung der Kriterien von Do No Significant Harm (DNSH) an.
Zusätzliche Gebäudeinformationen: Bietet ergänzende Daten zu dem Vermögenswert.
EPC- und Benchmark-Informationen: Enthält Energieausweise (EPCs) und Benchmarking-Daten.
Um den Wert in der detaillierten Aufschlüsselung zu berechnen, ist eine Bewertung erforderlich. Wenn keine Bewertung verfügbar ist, werden die Ausrichtung und die PEB/FEB-Benchmarks keinen Wert anzeigen.
Daten herunterladen: Sie können die Daten exportieren, indem Sie auf das Download-Symbol über der Tabelle klicken und Ihr bevorzugtes Format auswählen.