Energy Data Coverage
The Energy Data Coverage Dashboard gives you a comprehensive overview of building energy data availability and quality across your portfolio. It helps you spot gaps in data collection, track improvements over time, and assess building performance based on energy consumption metrics.
Report Features
The Data Coverage - Energy report is filtered by the Portfolio filter (top left) and additional filters (right panel).
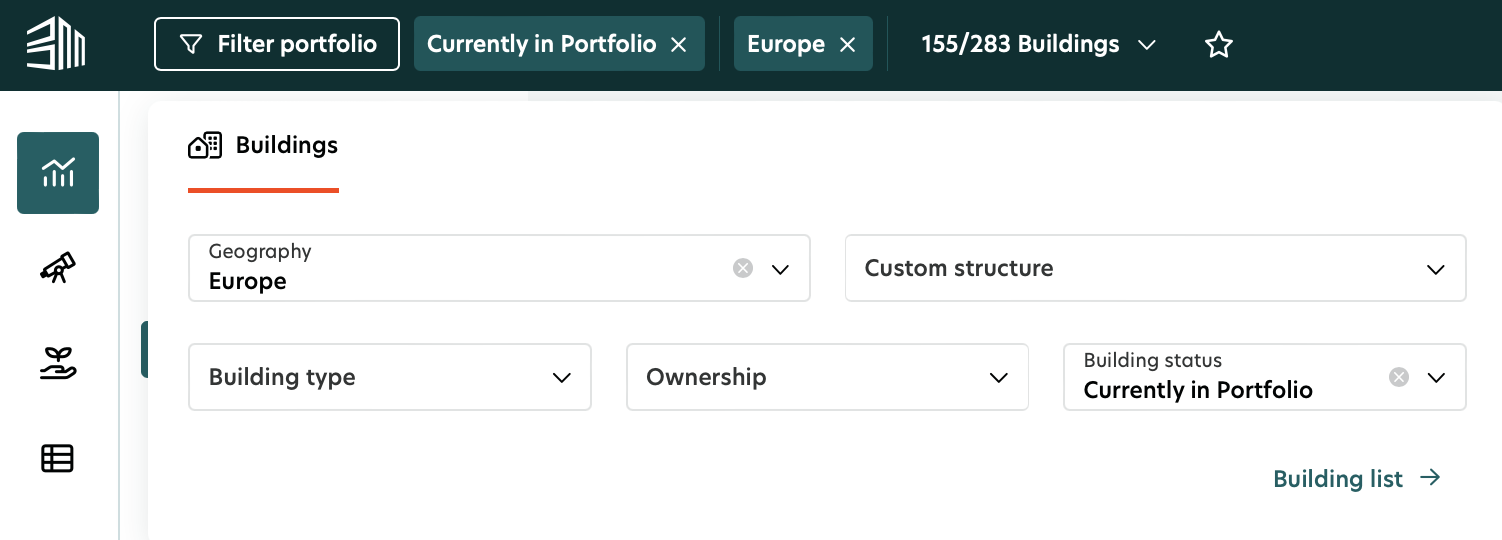
Portfolio Filter
The portfolio filter located at the top left of the page allows you to view data for the entire portfolio or selected regions, countries or buildings based on the geography or custom structure. Using this filter, you can specify the building type, ownership and building status to be considered in the displayed data.
Filter and Controls
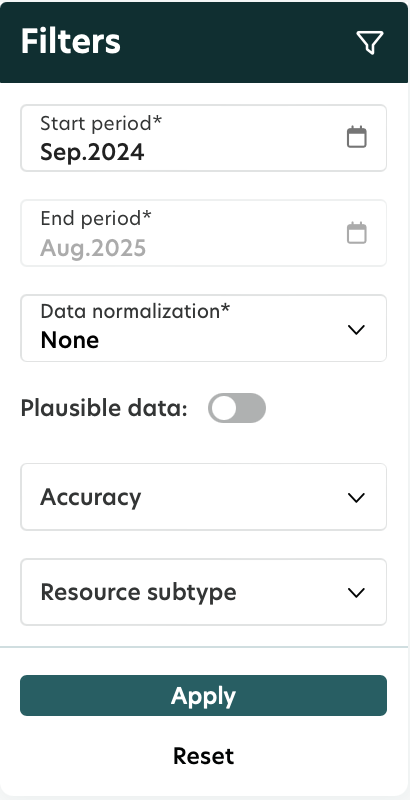
Data displayed in the Data coverage - Energy report is influenced by your selection of filters and controls. Below is a brief description of each filter:
Filter | Description |
|---|---|
Start period & end period | Define the start and end Month & Year used as timeframe (12 month period) for the data analysis. |
Plausible data | Define if you include plausibility checks or not in the insights by disabling and enabling the toggle. |
Accuracy | Select data accuracy levels such as Metered, Extrapolated, or Estimated, according to your data availability. |
Resource subtype | Define if all consumption data is included in the insights or only the data for specific resource subtypes. |
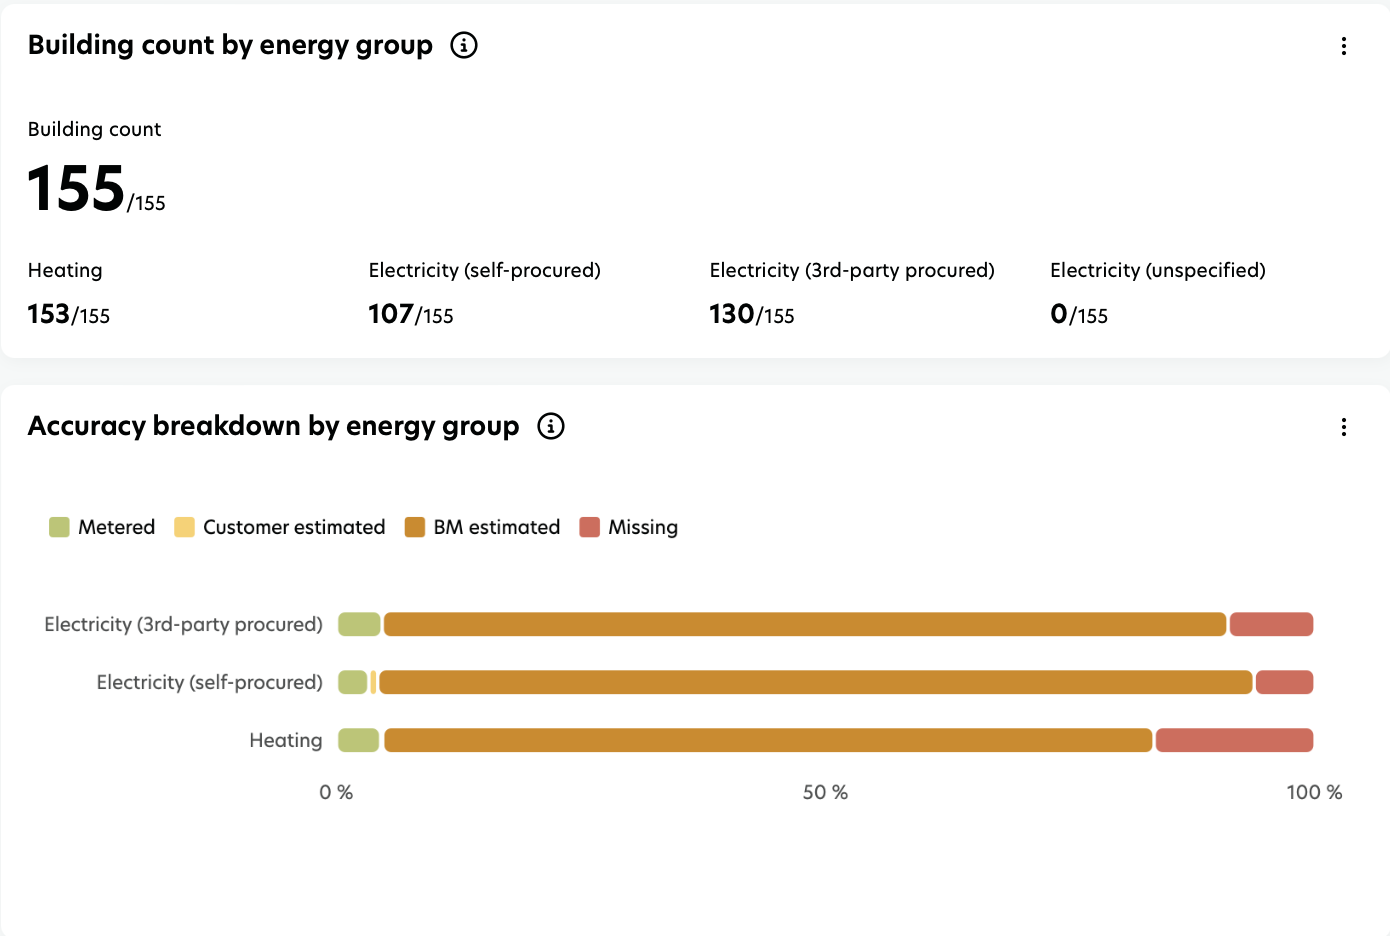
Building count by energy group
This visual representation helps you understand the coverage of energy data across your building portfolio. It shows:
The total number of buildings with any form of energy data. If the building has one energy entry available for the selected, it will be counted.
Of that total, how many buildings have:
Heating data
Electricity (self-procured)
Electricity (third-party procured)
Electricity (unspecified source)
This overview enables quick assessment of data completeness and highlights areas where energy data may be missing or require further validation.
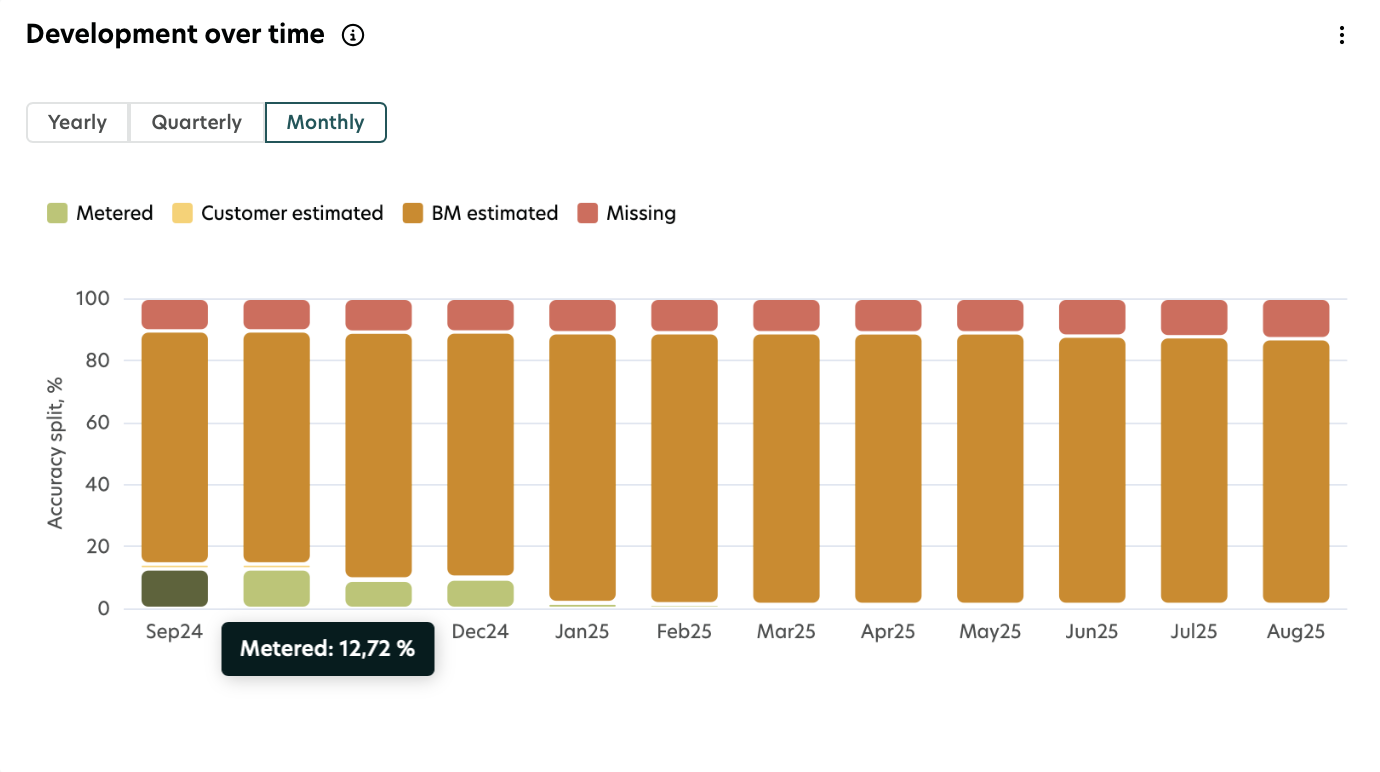
Development over time
This visual illustrates the development over time of energy data accuracy across the building portfolio. The stacked bar chart categorizes data into five types: Metered, Customer Estimated, BM Estimated, Missing, and Unspecified, each represented by a distinct color.
When hovering the bar graph, you can see the split in % for the different data sources of that corresponding category.
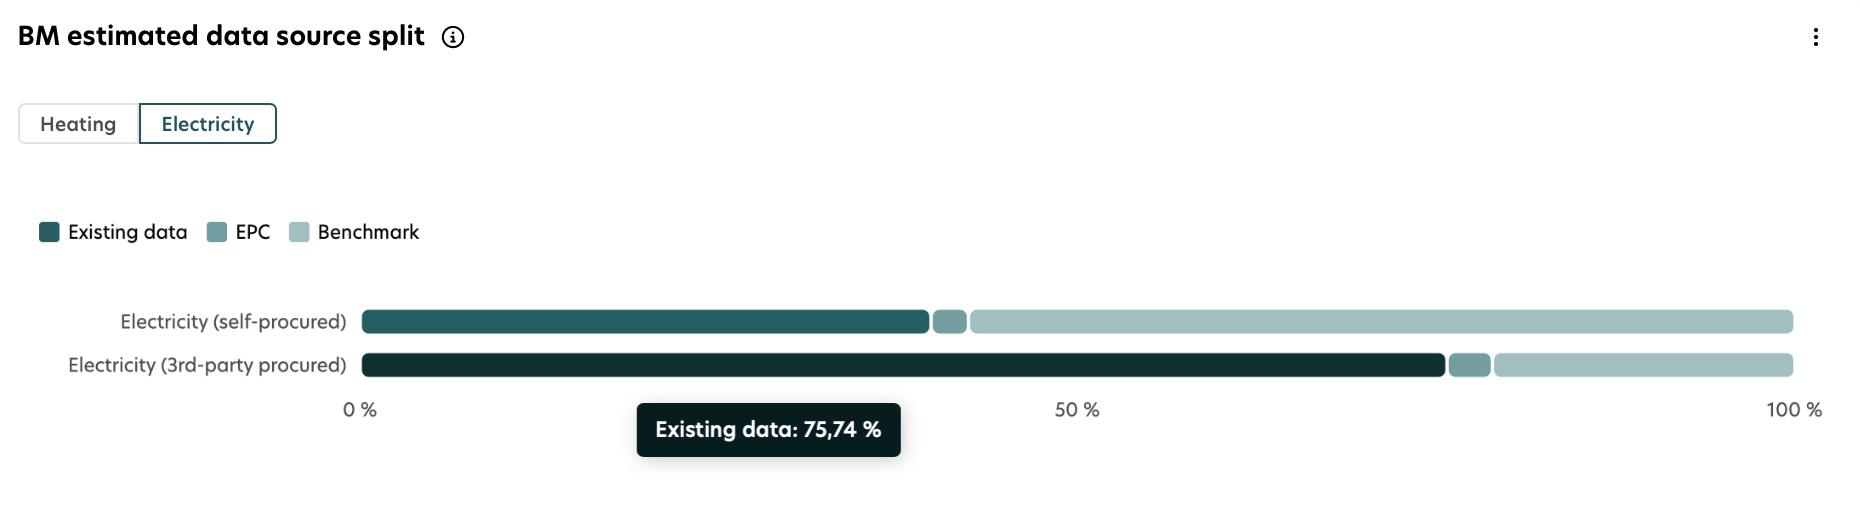
BM estimated data source split
This visual offers a detailed overview of the sources used by BuildingMinds data gap estimations for Electricity and Heating.
The length of each bar indicates the relative contribution of each method, helping you understand the accuracy and origin of the data. You can toggle between Electricity and Heating tabs to view similar breakdowns for heating data.
Building performance
This table displays a monthly overview of energy data considering the selected filters, split by the following columns: Building information (Site, Building name), Energy data information (Subtype, Procured by, Purpose, Accuracy, Source).
You can download this table in csv and excel by clicking the download icon above the top right corner.
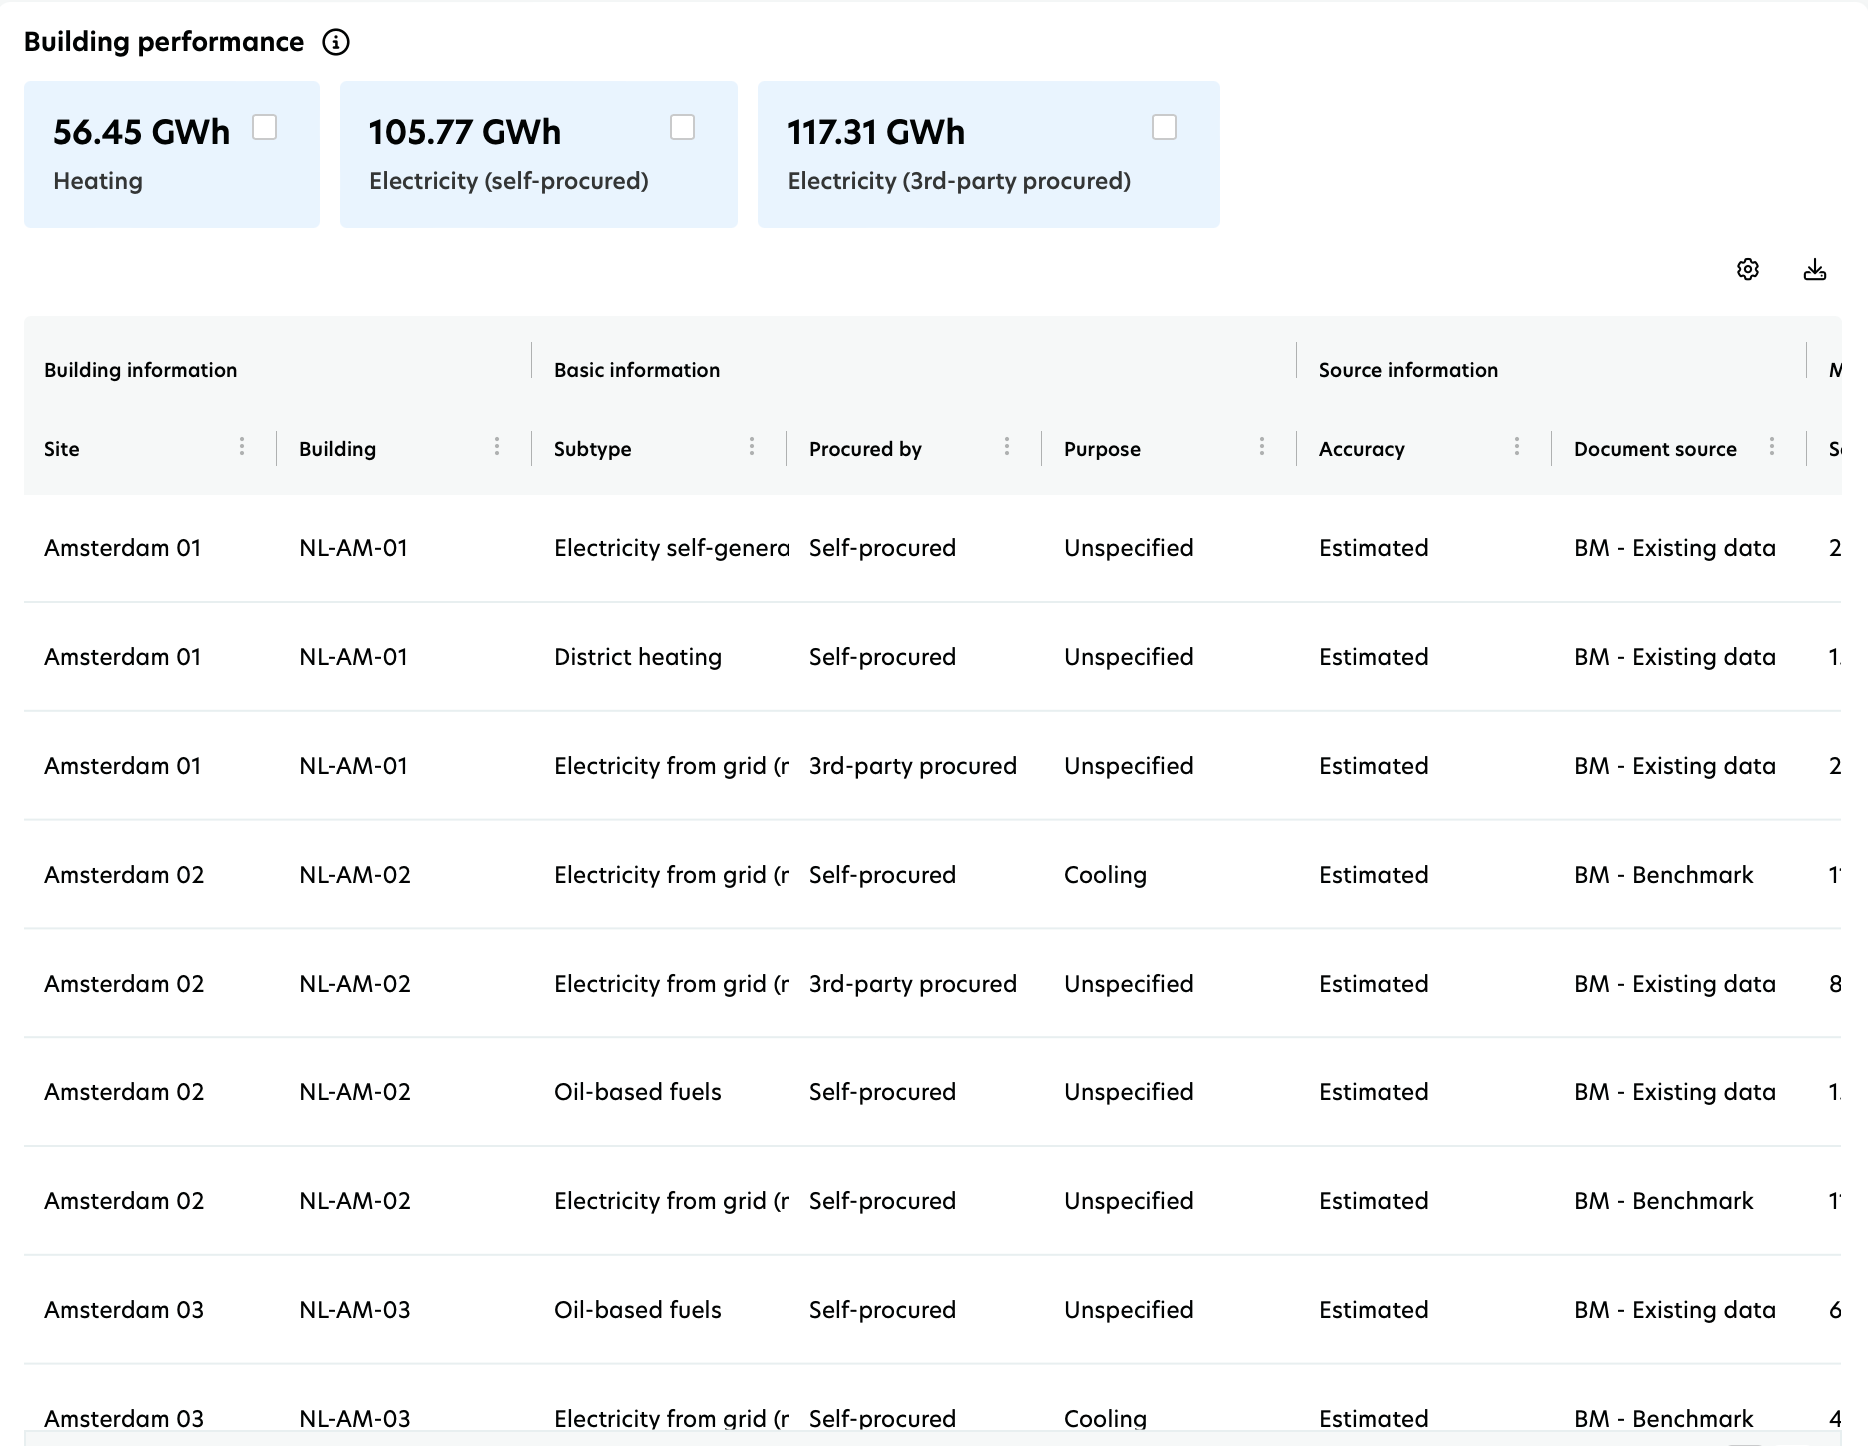
Document source: This field helps you understand where the data comes from. There are two main groups of data sources, each with several possible categories:
1. Metered data - sources where you manually upload or enter data into the platform:
Manual input: You enter the data yourself.
Export: Data brought in through an exported file.
Invoice: Data taken directly from an uploaded invoice.
Invoice scraper: Data automatically read from your invoice.
Survey: Data collected through a survey.
Meter: Data taken directly from a meter reading.
2. BM Estimated data - these categories show how the system (BM) estimates values when the original data is not available:
BM-Existing data: Uses the data you already provided to estimate missing values.
BM-EPC: Uses your EPC information to estimate values.
BM-Benchmark: Uses benchmarks as a reference.
BM-Calculations: Appears when the system cannot estimate a value and leaves the entry as "missing".