Overview page
On the Overview page, you’ll get insights into how your buildings use resources and contribute to emissions. It gives you a clear summary of consumption by resource type, helping you understand performance across your portfolio or for a single building.
Access the report
Select the Data insights icon in the left menu.
Select the Overview under Resources & emissions report.
Filter Overview report
The Filters section is located just below the top bar, in the upper right corner of the page.
For a detailed overview and explanation of the filters, see filters overview.
Visualizations and Insights
1. Overview
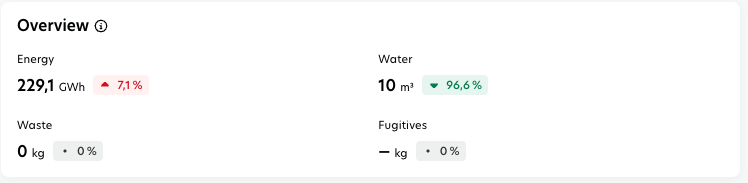
In the Overview section, you’ll get a quick snapshot of how your buildings consume energy, water, and waste, as well as the fugitive emissions associated with building operation. It helps you spot trends across these four resource areas and understand overall performance.
Key performance indicators (KPIs)
You’ll see KPIs calculated by resource type - Energy, Water, Waste, and Fugitives.
Consumption: shows the sum of all consumption used in the selected buildings & for the selected time period, calculated in absolute value or intensity.
Year-over-year (YoY) change: highlights the change in % in the consumption between the selected period and the same period in the previous year.
2. Operational emissions
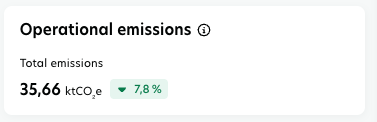
In this section, you’ll get a quick snapshot of the overall portfolio emissions, helping you identify consumption trends.
Key performance indicators (KPIs)
The KPI is calculated for total emissions.
Operational emissions: shows the sum of all operational emissions per building for the selected time period, calculated in absolute value or intensity.
Year-over-year (YoY) change: highlights the change in % in the emissions between the selected period and the same period in the previous year.
3. Consumption data coverage
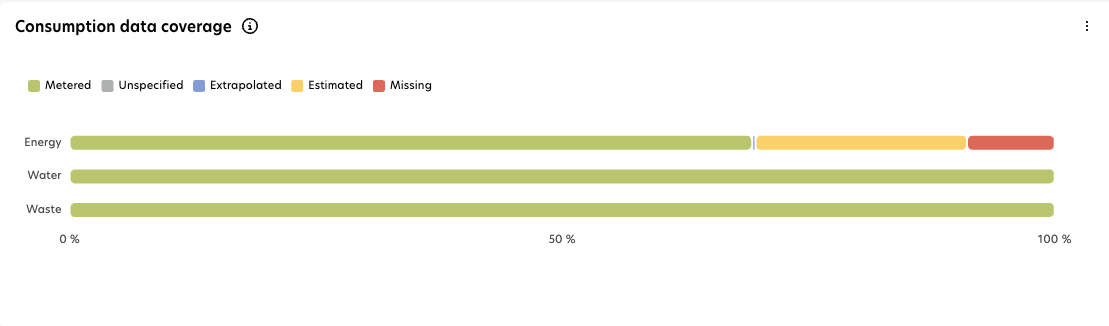
This section shows you what kind of data is available for each resource type - whether it's metered, estimated, extrapolated, unspecified, or missing. It helps you understand where your data comes from and how accurate it might be.
4. Building Performance
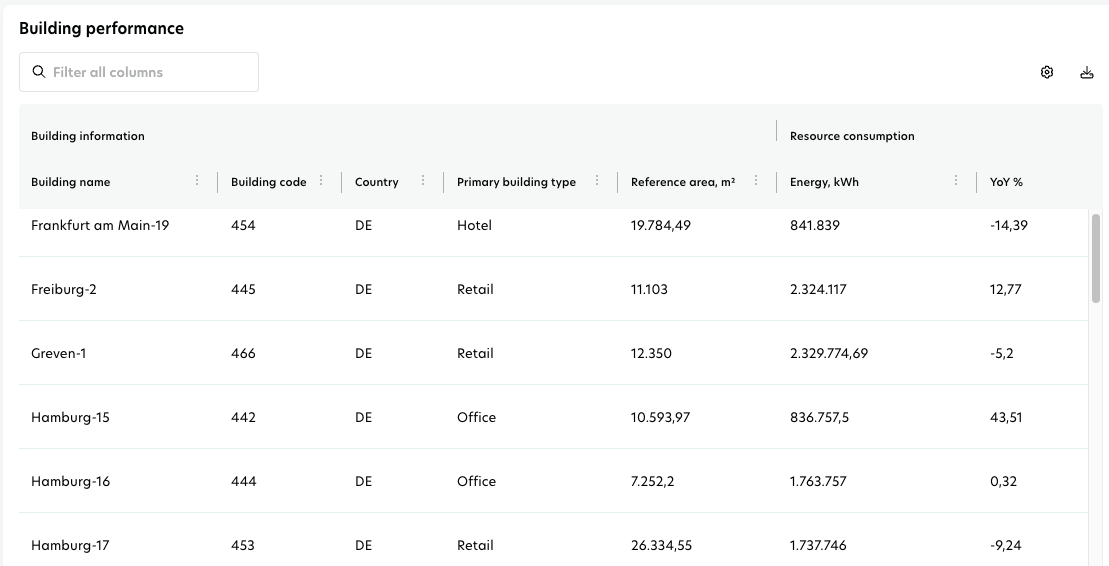
This table supports benchmarking and portfolio comparison, allowing you to quickly identify high- and low-performing buildings within the same category.
Key performance indicators (KPIs)
Building information: building name, code, country, primary building type, and reference area.
Resource consumption: shows the total consumption for each resource type per building during the selected time period, shown as an absolute value or intensity.
Year-over-year (YoY) change: shows the change in % in the consumption between the selected period and the same period in the previous year for each building.
Operational emissions: shows the sum of all operational emissions per building for the selected time period, calculated in absolute value or intensity.
You can export the data of the table to a csv or excel file using the download icon above the table and selecting the export format.