The EU Taxonomy Dashboard is a comprehensive reporting tool designed to provide users with insights into the current status of their building assessments for EU Taxonomy activities. It delivers a clear overview of a portfolio’s alignment with EU Taxonomy requirements, empowering users to monitor compliance and pinpoint areas for potential improvement. This dashboard serves as a valuable resource for organizations aiming to streamline their reporting processes and ensure alignment with regulatory standards.
How to access
Login to the BuildingMinds platform.
Select Reports from the left side menu.
Under Regulatory, click on EU taxonomy to access the relevant report.
Filters & controls:
Available information: toggle the charts between Mitigation or Adaptation.
Year: by default, the last year when EU taxonomy assessment was conducted is selected. You can choose a different (available) year in the dropdown menu.
Version: Currently only 7.7
As additional versions are developed, they will become accessible through this filter.
Alignment overview
EU Taxonomy KPIs
This section presents three KPIs, each divided into specific metrics to provide a detailed view of EU Taxonomy alignment within your portfolio.
GAV (Gross Asset Value)
Numerator: Reflects the alignment of EU Taxonomy sub-objectives for both Substantial Contribution (SC) and Do No Significant Harm (DNSH).
Denominator: Represents the total valuation of your portfolio.
Assets
Numerator: Displays the total number of assets that are fully aligned with both SC and DNSH criteria.
Denominator: Indicates the total number of buildings within the portfolio.
Area
Numerator: Represents the area associated with buildings that meet alignment requirements for both SC and DNSH.
Denominator: Shows the total area encompassed by the portfolio.
These KPIs are designed to provide a clear and actionable breakdown of your portfolio’s EU Taxonomy compliance, enabling informed decision-making and efficient monitoring of alignment progress.
Gross Asset Value (GAV) is the most critical KPI in the context of EU Taxonomy reporting. An asset will only be considered aligned under the EU Taxonomy Regulation if it meets the requirements for both sub-objectives: Substantial Contribution and Do No Significant Harm (DNSH). Assets that do not fulfil both criteria are excluded from the aligned GAV calculation.
Understanding the charts
This section offers a comprehensive breakdown of the Substantial Contribution (SC) and Do No Significant Harm (DNSH) statuses in relation to the Gross Asset Value (GAV) of the assessed buildings. It provides a visual representation of the distribution of assets based on their alignment with the SC/DNSH objectives outlined in the EU Taxonomy framework.
Status Categories
Aligned: Indicates that the asset is fully aligned with the EU Taxonomy sub-objective.
Not Aligned: Denotes that the asset does not meet the alignment criteria for the EU Taxonomy sub-objective.
Aligned Pending Evidence: Highlights assets that are conditionally aligned, requiring the user to provide relevant supporting evidence to confirm the status as "Aligned."
Incomplete: Indicates that the assessment for the asset is still incomplete, and further steps are needed to determine its final status.
This chart serves as a valuable tool for tracking the alignment progress of assessed buildings and facilitating compliance with EU Taxonomy requirements.
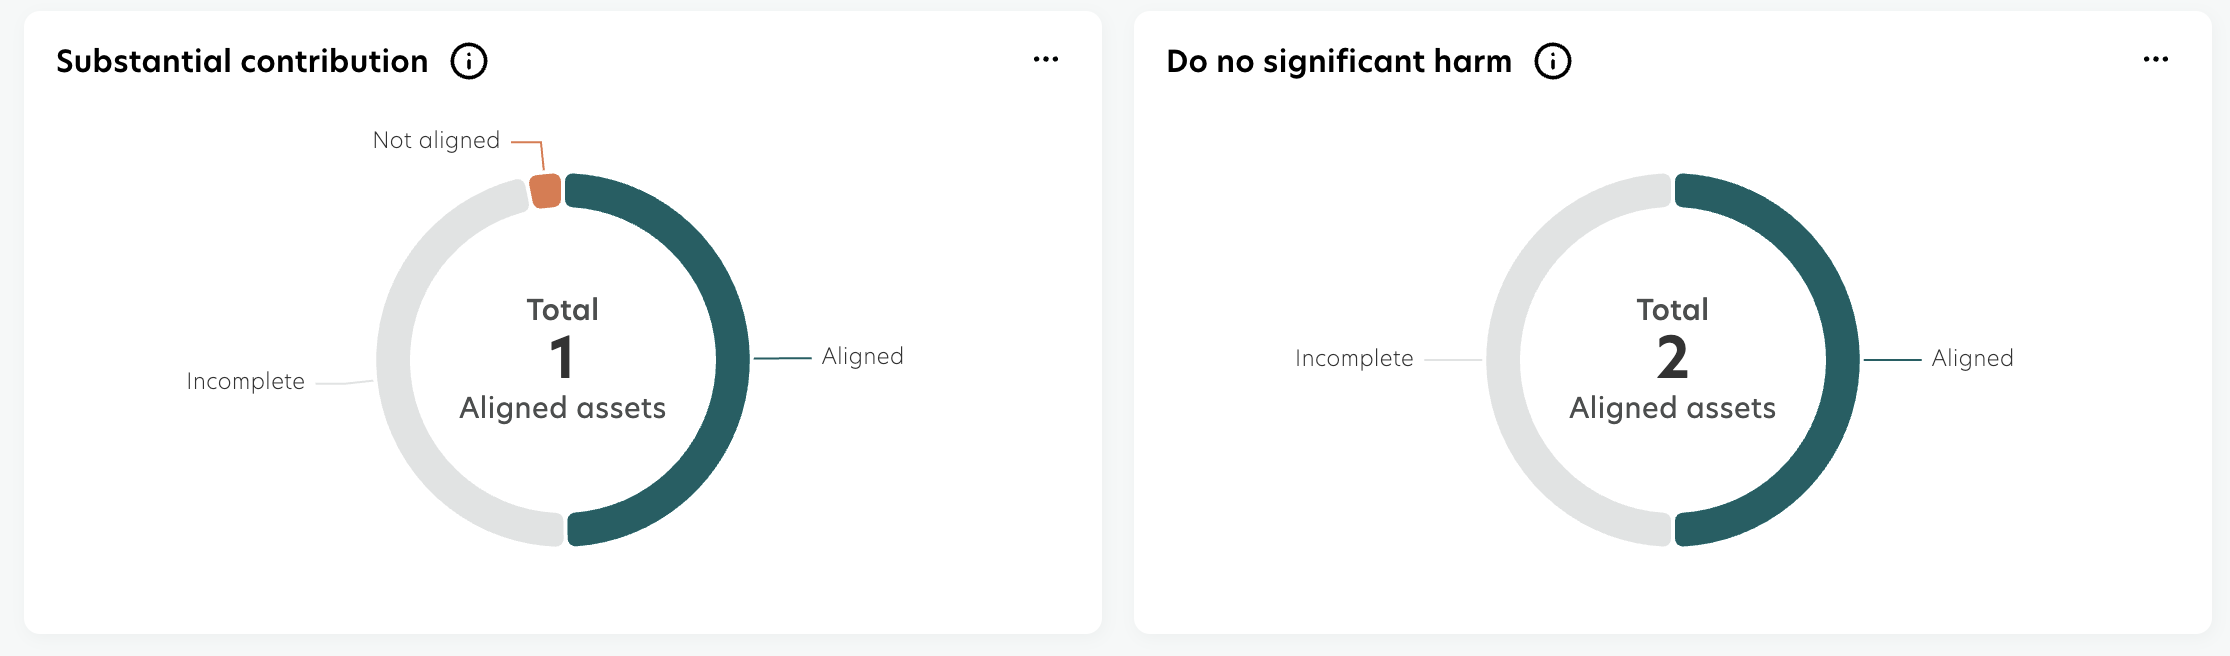
The donut chart visually represents the distribution of Gross Asset Value (GAV) across each Substantial Contribution (SC) status category. At the center of the chart, the displayed figure indicates the total number of assets that are fully (100%) aligned with the Substantial Contribution and Do No Significant Harm (DNSH) objectives. These assets have successfully met all required criteria under this specific EU Taxonomy sub-objective.
The building has to be 100% aligned to be considered a count of aligned assets in the charts. In case there is no assessment conducted on any of the buildings, the chart will display “No data”.
Data coverage
Status Classification: Complete vs. Incomplete Assessments
The status Complete includes all assets for which an assessment has been conducted, regardless of the outcome. This category encompasses:
Aligned: Assets fully meeting the EU Taxonomy criteria.
Not Aligned: Assets that do not meet the alignment criteria.
Aligned Pending Evidence: Assets where the assessment indicates alignment but supporting documentation is still required.
In contrast, the status Incomplete refers to assets for which the assessment process has not been finalized. This includes:
Partially Completed Assets: Assets marked as incomplete due to partially available or under-review data.
Assets with No Report: Assets where no assessment has been initiated, or data has not been submitted.
This classification enables users to efficiently distinguish between assets with finalized assessment outcomes and those that require additional input or analysis.
The chart highlights the percentage distribution of assets that are fully aligned with key EU Taxonomy principles versus those categorized as incomplete, providing users with a clear understanding of progress and areas requiring further attention.
Detailed breakdown
The detailed breakdown structure provides a comprehensive, itemized view of each building within your portfolio. This dynamic table adjusts its display based on your current navigation or applied filter settings, ensuring that only the most relevant properties and associated data are presented within the selected context.
Column Categories
The table is organized into various categories for ease of analysis:
Taxonomy Status
: Displays the EU Taxonomy alignment status of each building.
Building Information
: Provides key details about the building, such as name and location.
Substantial Contribution Split
: Highlights the alignment status with Substantial Contribution (SC) criteria.
DNSH Split
: Indicates compliance with Do No Significant Harm (DNSH) criteria.
Building Additional Information
: Offers supplementary data related to the asset.
EPC and Benchmark Information
: Includes energy performance certificates (EPCs) and benchmarking data.
Functionality
The table supports export options in .csv and .xls formats, allowing users to easily download and analyze the data offline. All standard grid functionalities, such as sorting, filtering, and pagination, are implemented for seamless navigation and usability.
Chart Insights
The table provides valuable insights, including:
Detailed information about each asset in the portfolio.
Identification of assets aligned with EU Taxonomy objectives and their geographic locations.
Visibility into missing information for specific assets, enabling targeted follow-up actions.
This breakdown structure empowers users to efficiently monitor, evaluate, and manage their portfolio in alignment with EU Taxonomy principles.