Emissions page
On the emissions page, you’ll get insights into operational emissions for your real estate portfolio or a single building. It gives you an overview of operational emissions for different energy use and other resources, emissions breakdowns by resource types, scopes, procurement types, and building-level performance.
Access the report
Select the Data insights icon in the left menu.
Select the Emissions under Resources & emissions report.
Filter Emissions report
The Filters section is located just below the top bar, in the upper right corner of the page.
For a detailed overview and explanation of the filters, see filters overview.
Visualizations and Insights
1. Emissions per resource type, tCO2e or tCO2e/m2
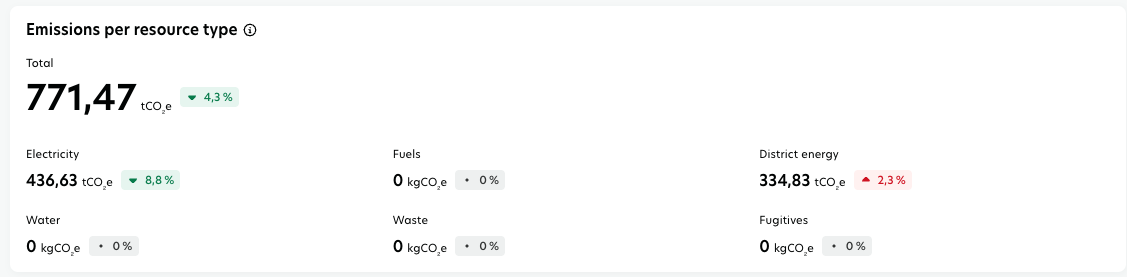
This widget gives you a quick snapshot of emissions across your portfolio, broken down by energy and resource types. It helps you identify which resources contribute most to emissions and spot trends over time.
Key performance indicators (KPIs)
The KPIs are calculated by energy and resource type (Electricity, Fuels, District Energy, Water, Waste, Fugitives). This excludes energy used for electric vehicle charging.
Emissions: shows the total emissions from the selected buildings and resource types during the selected time period, calculated in absolute value or intensity.
Year-over-year (YoY) change: displays the percentage change in emissions between the selected period and the same period last year.
2. Emissions per Scope
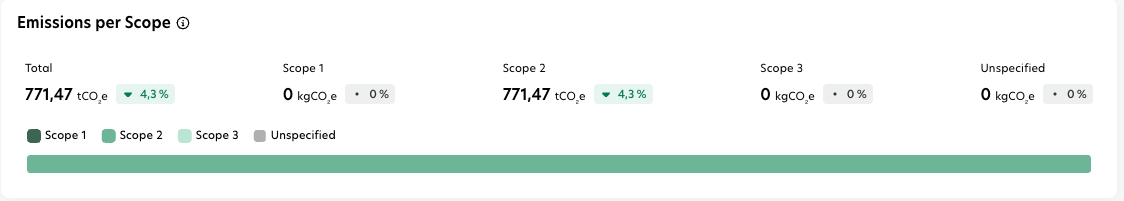
This widget gives you a quick snapshot of emissions across your portfolio, broken down by scope, helping you identify trends.
Key performance indicators (KPIs)
The KPIs are calculated by scope (1, 2, 3, and unspecified), excluding energy used for electric vehicle charging.
Emissions: shows the total emissions from the selected buildings and scope during the selected time period, calculated in absolute value or intensity.
Year-over-year (YoY) change: displays the percentage change in emissions between the selected period and the same period last year.
3. Development over time
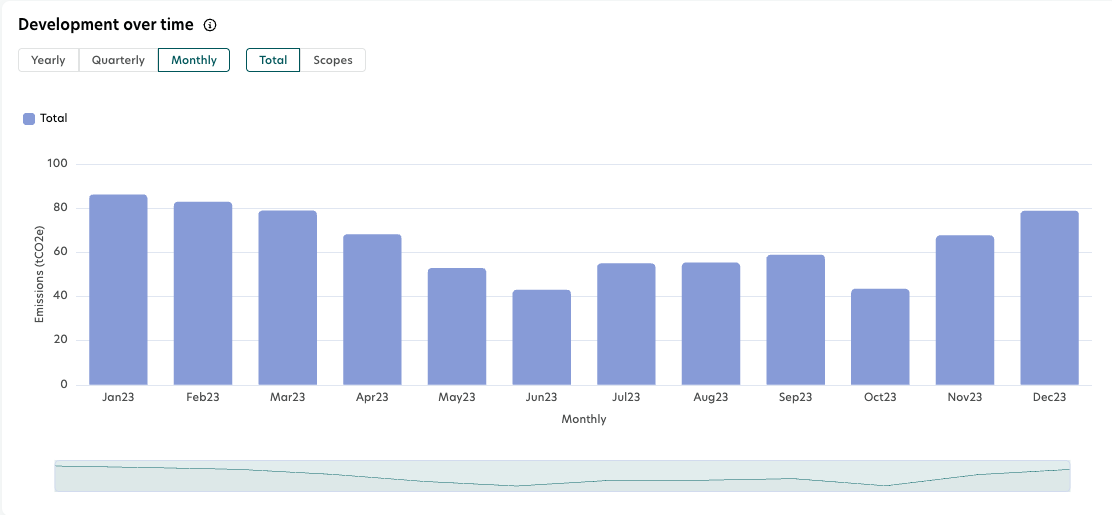
This chart helps you spot seasonal peaks and long-term emissions patterns, supporting your operational planning.
The split by scope shows which scopes drive the consumption in your portfolio or building over time.
Key performance indicators (KPIs)
The KPIs are calculated by scope (Scope 1, Scope 2, Scope 3, and unspecified), excluding energy used for electric vehicle charging.
Yearly/Quarterly/Monthly Total: shows emissions per year, quarter, or month in the selected buildings for the selected time period, plus the three previous years.
Yearly/Quarterly/Monthly Scopes: same as above, divided by Scopes
4. Building Performance
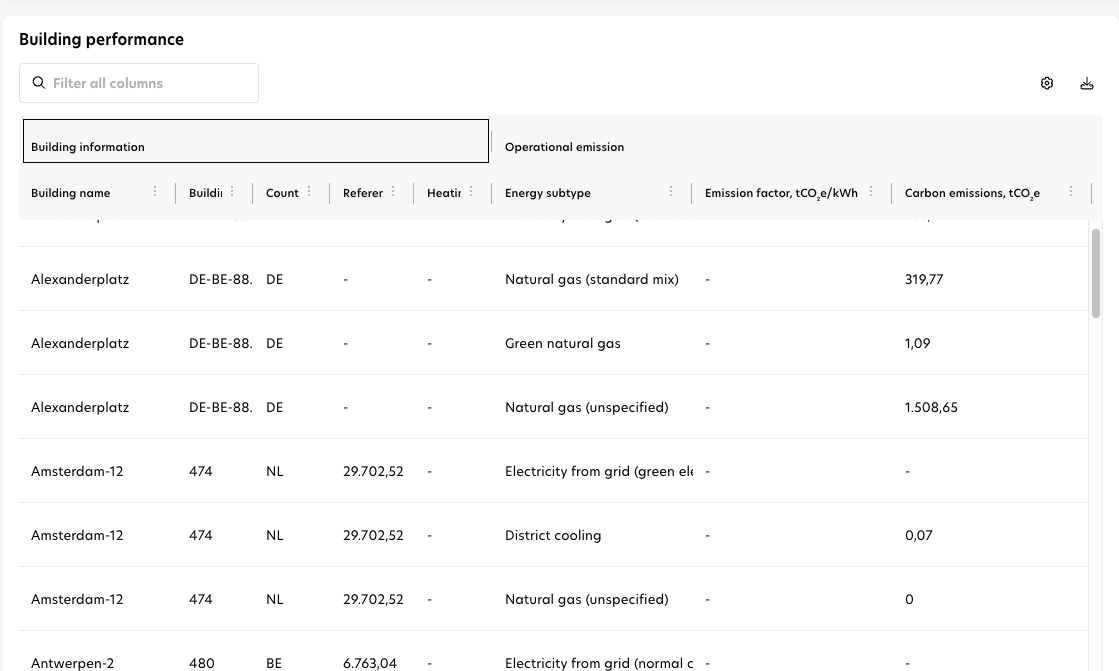
This table supports benchmarking and portfolio comparison, helping you quickly identify high- and low-performing buildings within the same category.
Key performance indicators (KPIs)
You’ll see the following KPIs for each building (energy used for electric vehicle charging is excluded):
Building information: building name, building code, country, reference area, and heating type.
Operational emissions: displays the sum of all operational emissions for each resource type and scope per building for the selected time period, calculated in absolute value or intensity.
Year-over-year: shows the percentage change in emissions between the selected time period and the same period last year, for each building.
Download data: You can export data from the table to a CSV or Excel file using the download icon above the first table and selecting your preferred export format.