Retrofit Asset Prioritization
The retrofit asset prioritization tool supports users in identifying buildings within their portfolio that are projected to contribute most to long-term energy consumption and emissions above CRREM targets.
How assets are ranked
The tool ranks buildings based on their excess energy use, emissions, and current energy intensity. Using this information, it highlights assets with the greatest potential for improvement and supports your retrofit planning. The page includes visual widgets, filters, and a ranked list of top-priority buildings.
Assets are ranked using a multi-criteria decision analysis (MCDA), which considers three equally weighted environmental indicators:
Excess energy until 2050: The projected amount of energy consumption above the CRREM target from the current year through 2050.
Excess emissions until 2050: The projected CO₂e emissions exceeding the CRREM target over the same period.
Energy intensity (current year): The energy consumption per gross internal floor area (kWh/m²/year).
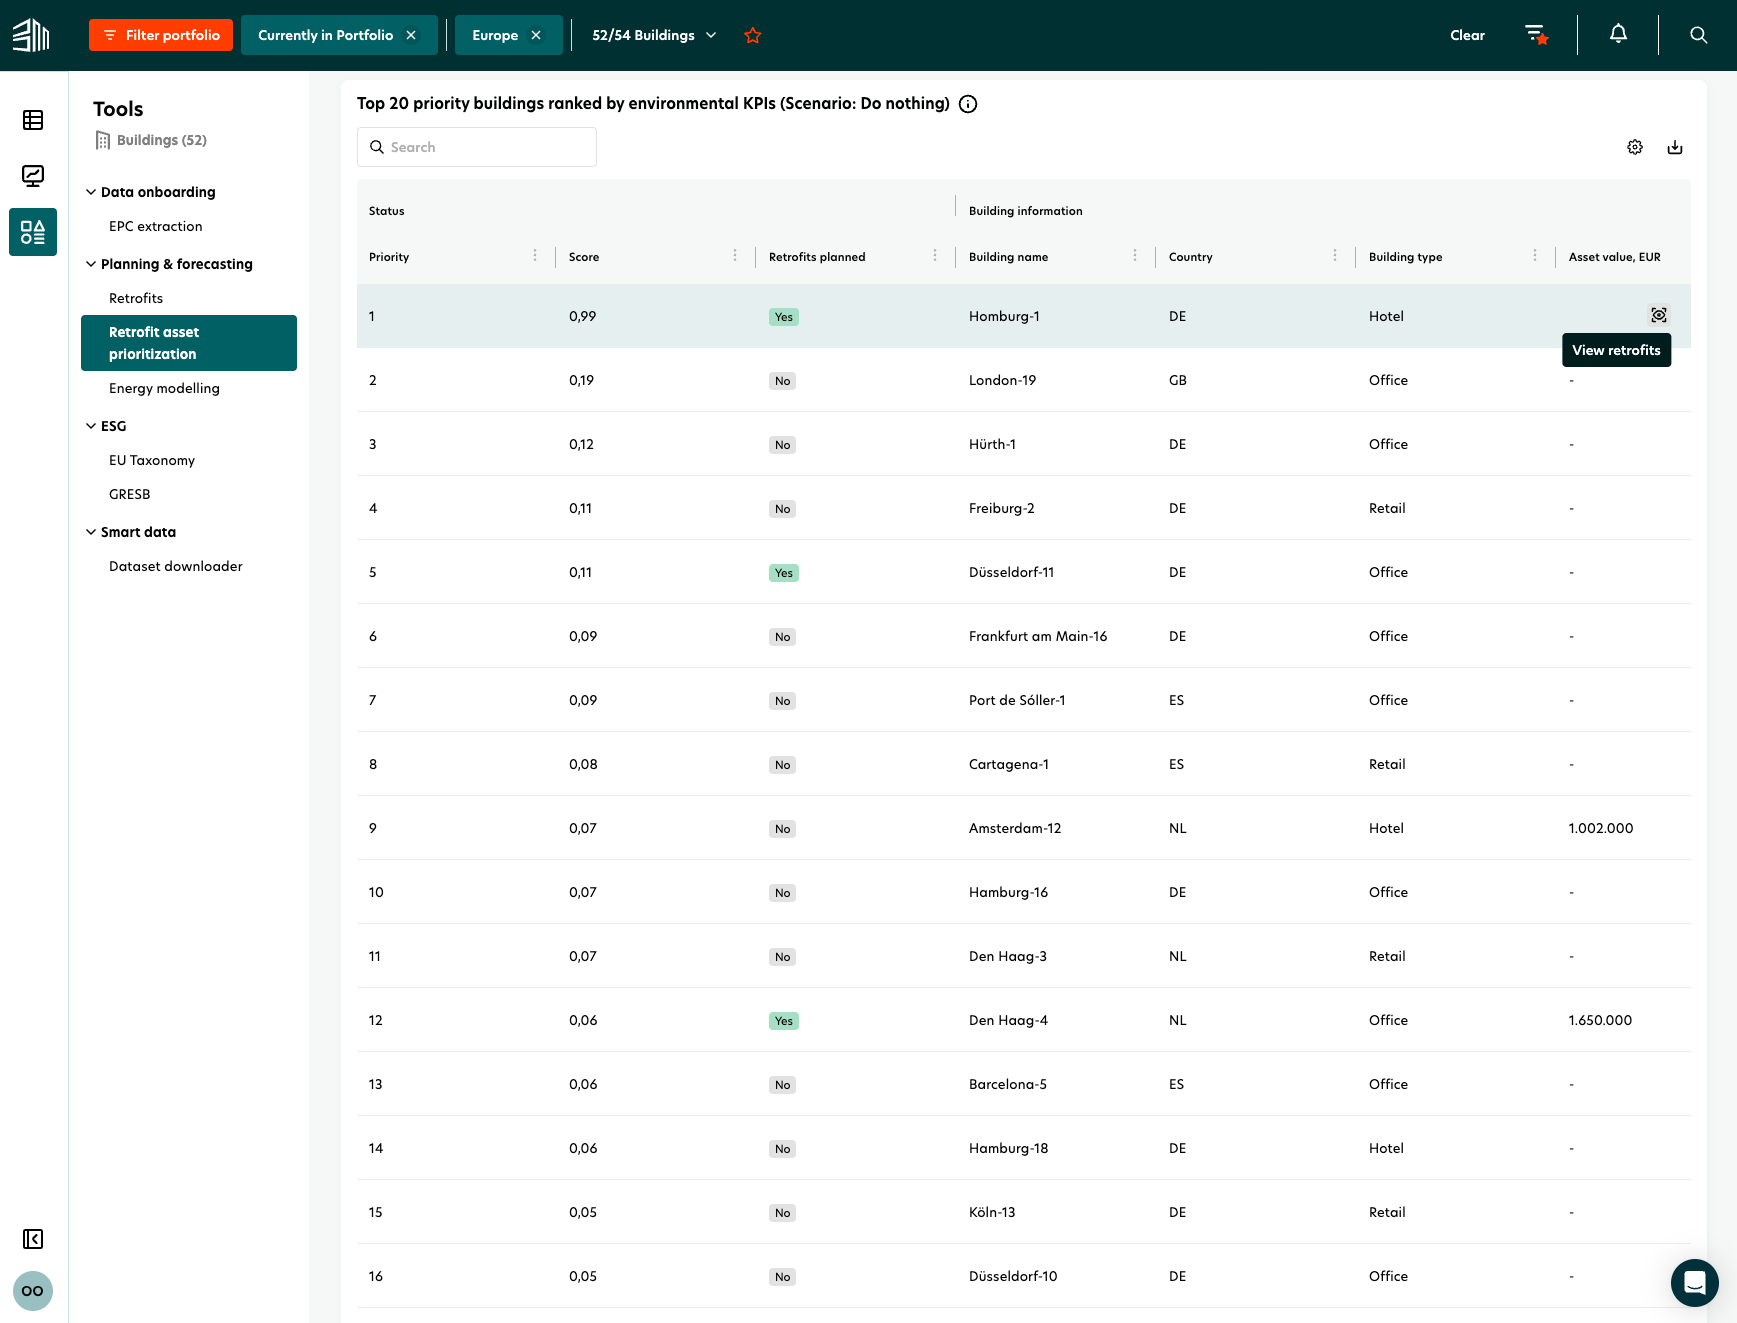
Each of these metrics contributes one-third of the asset’s total score. Buildings are listed in descending order, with those having the highest environmental impact appearing at the top. The list includes relevant attributes such as retrofit plans, location, building type, asset value, and sustainability indicators.
Only buildings with complete data—including gross internal area, CRREM targets, and at least one full year of energy-type operational measurements—are included in the prioritization. Buildings missing any of these are excluded from the ranking.
What the page displays
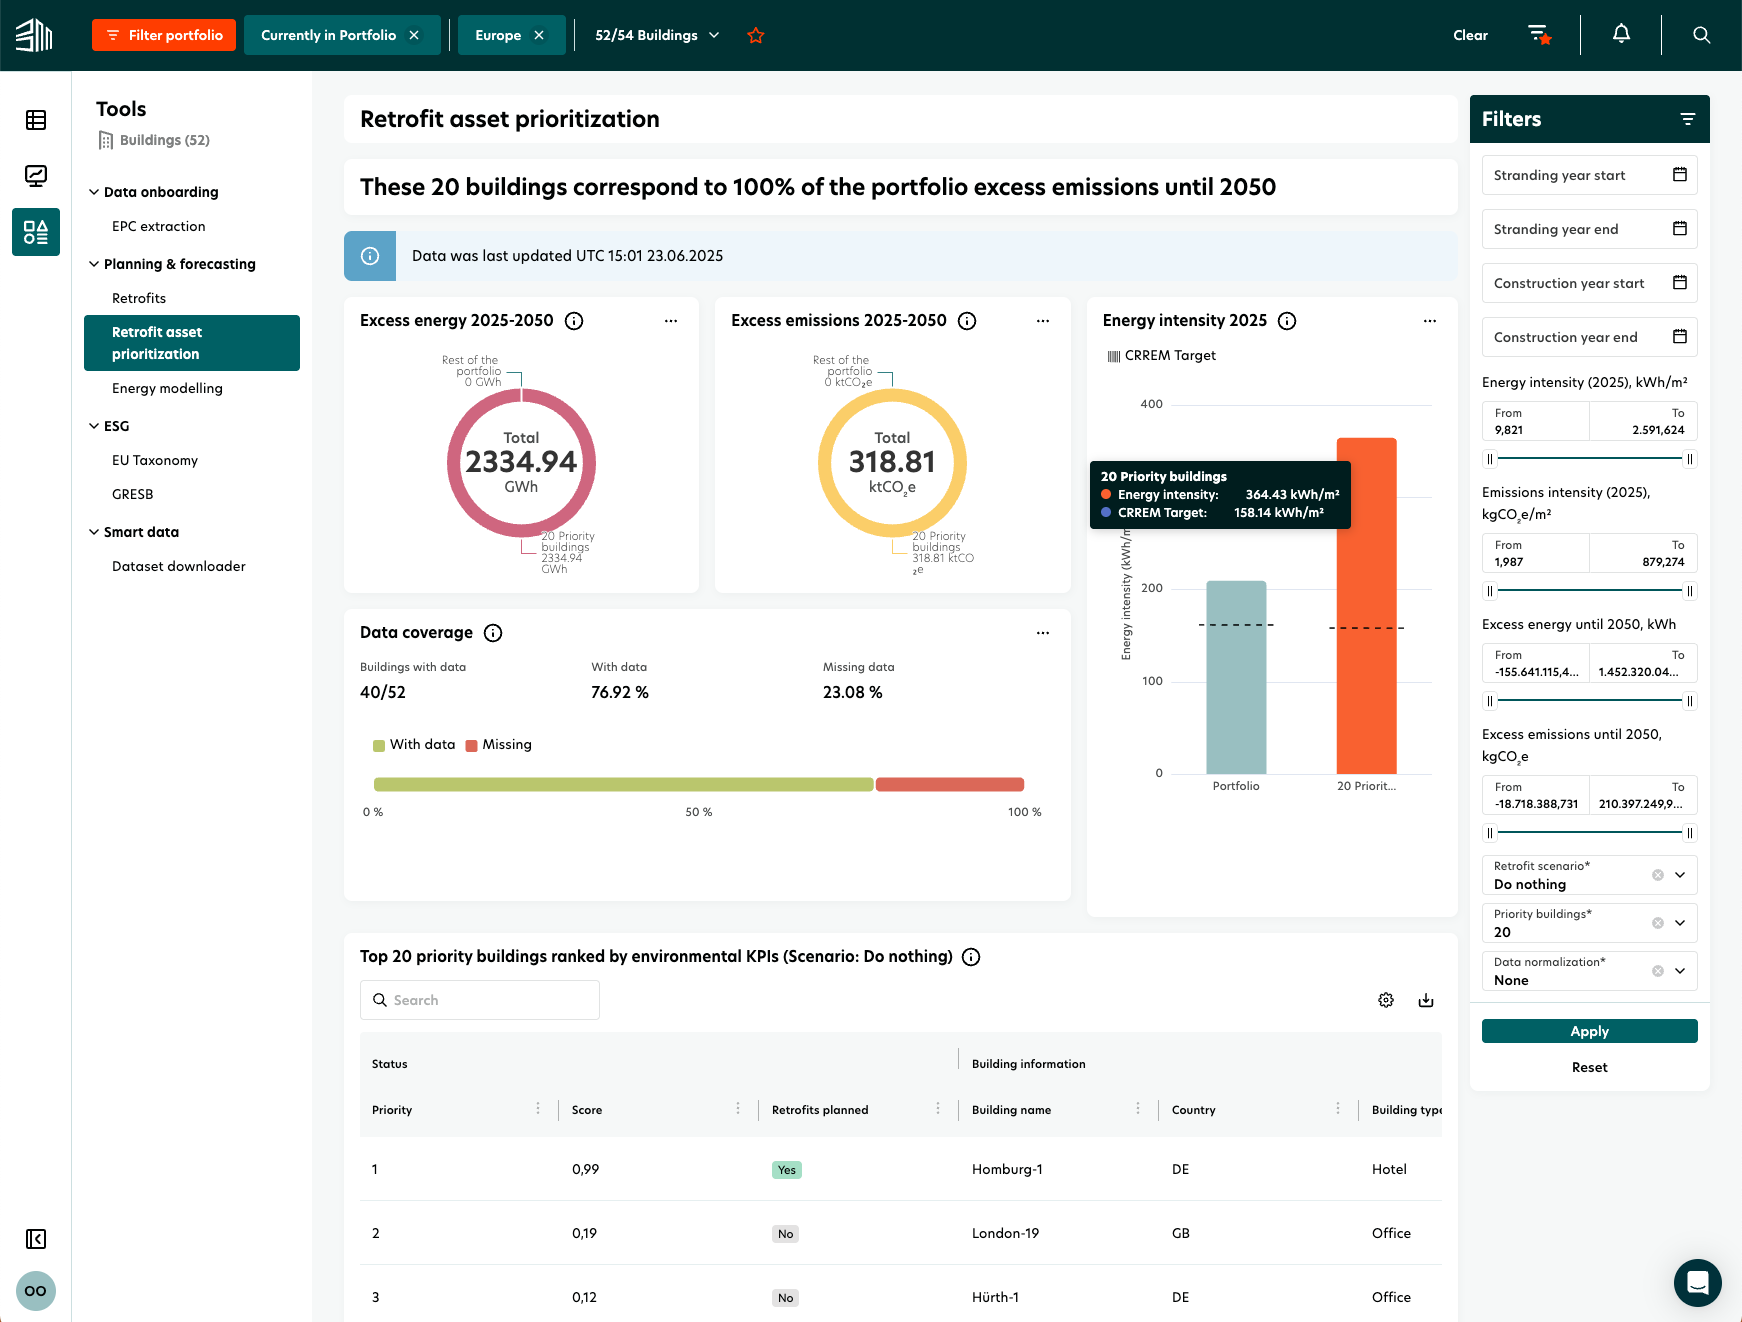
The page displays several components to help interpret and act on the prioritization:
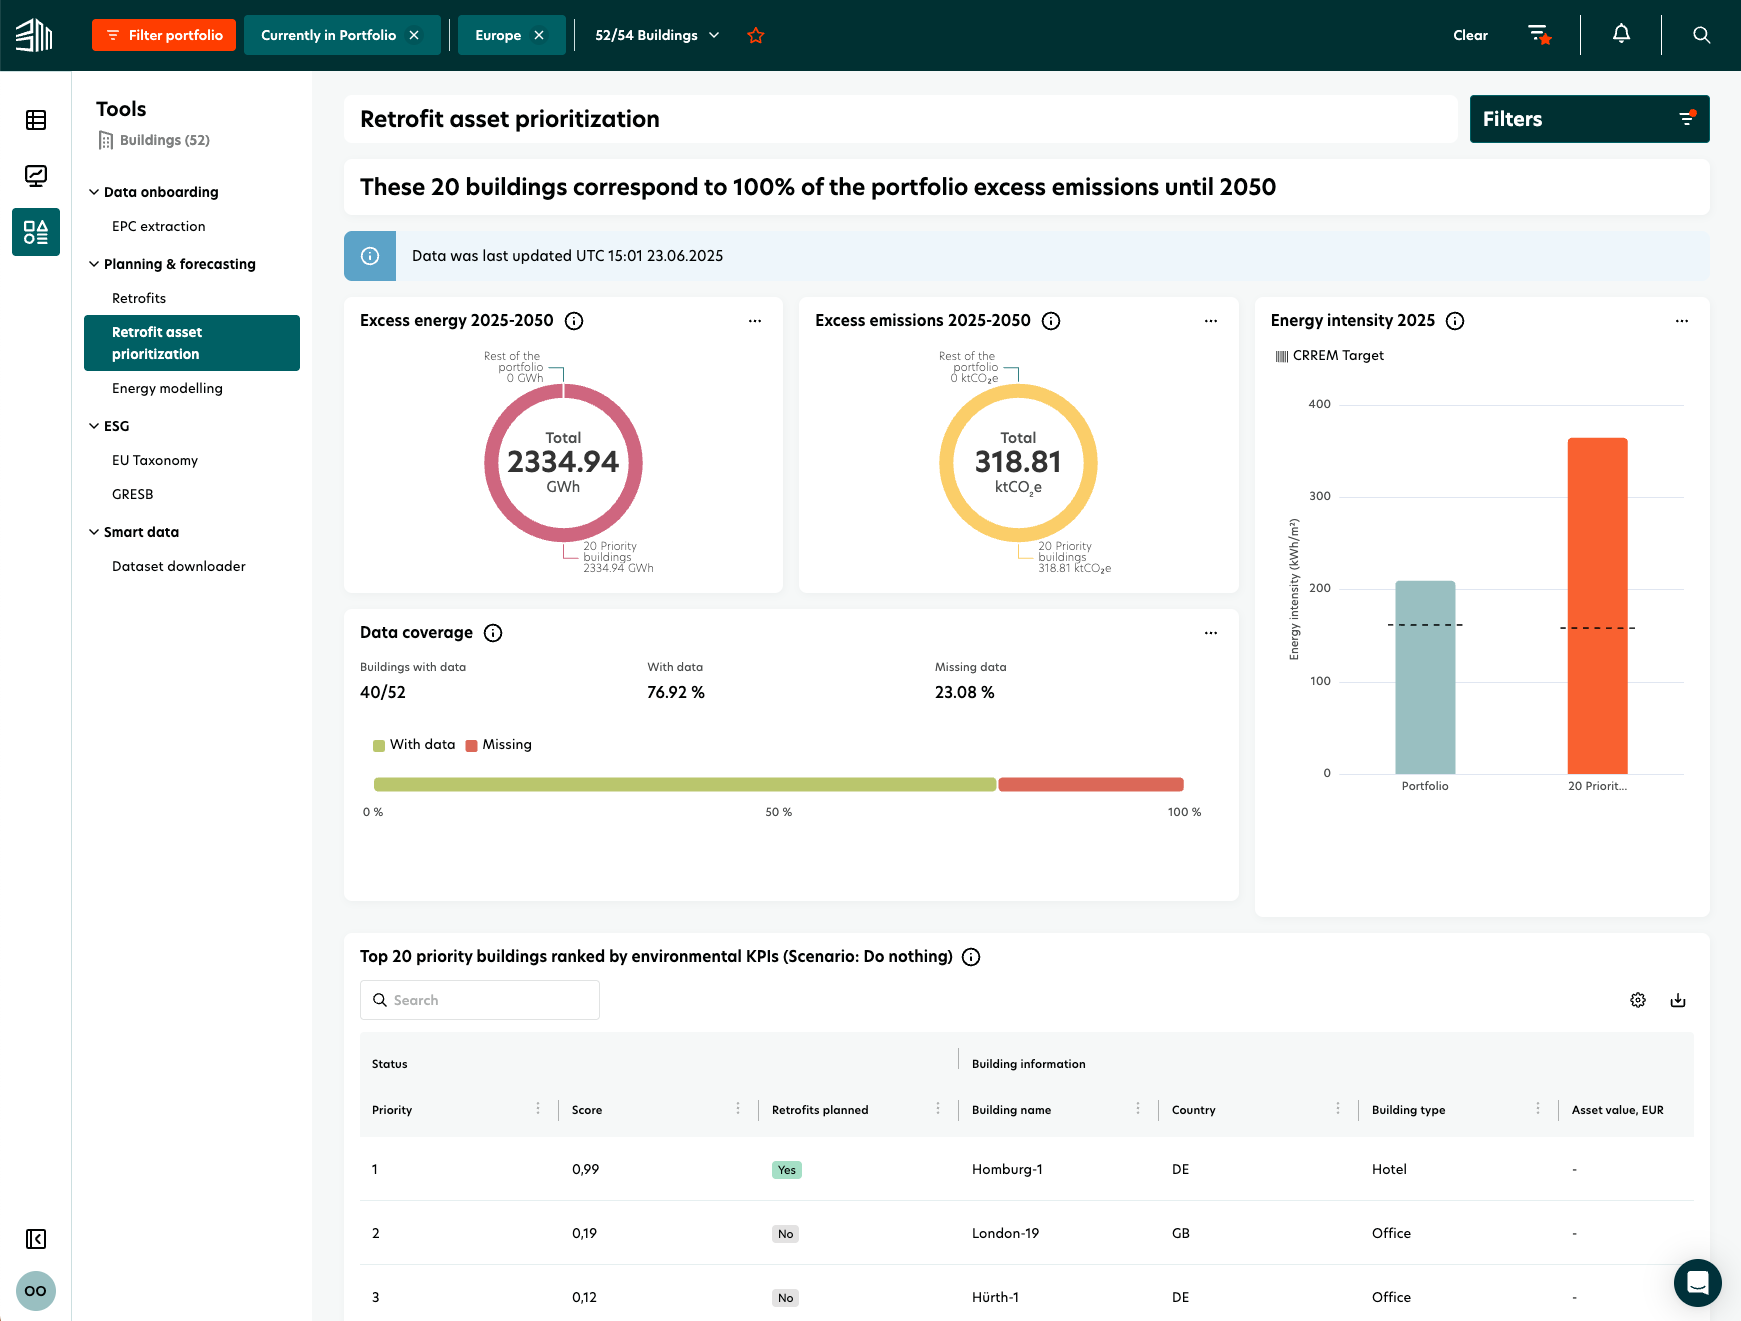
Excess energy (current year–2050): Visualizes energy consumption exceeding the CRREM 2°C target compared to the rest of the portfolio.
Excess emissions (current year–2050): Displays projected emissions above the CRREM target for priority buildings versus others.
Energy intensity (current year): Compares actual energy intensity to the CRREM target for both priority buildings and the overall portfolio.
Data coverage widget: Indicates the proportion of the portfolio with complete data required for prioritization.
Priority buildings list: Displays top-ranking buildings based on filter settings. The table supports sorting, searching, and exporting to CSV or XLSX formats. Users can also navigate to the Retrofit Planning page via the “View retrofits” icon.
Using filters
Filtering options in the right-hand panel and top-left portfolio selector allow refinement of the analysis:
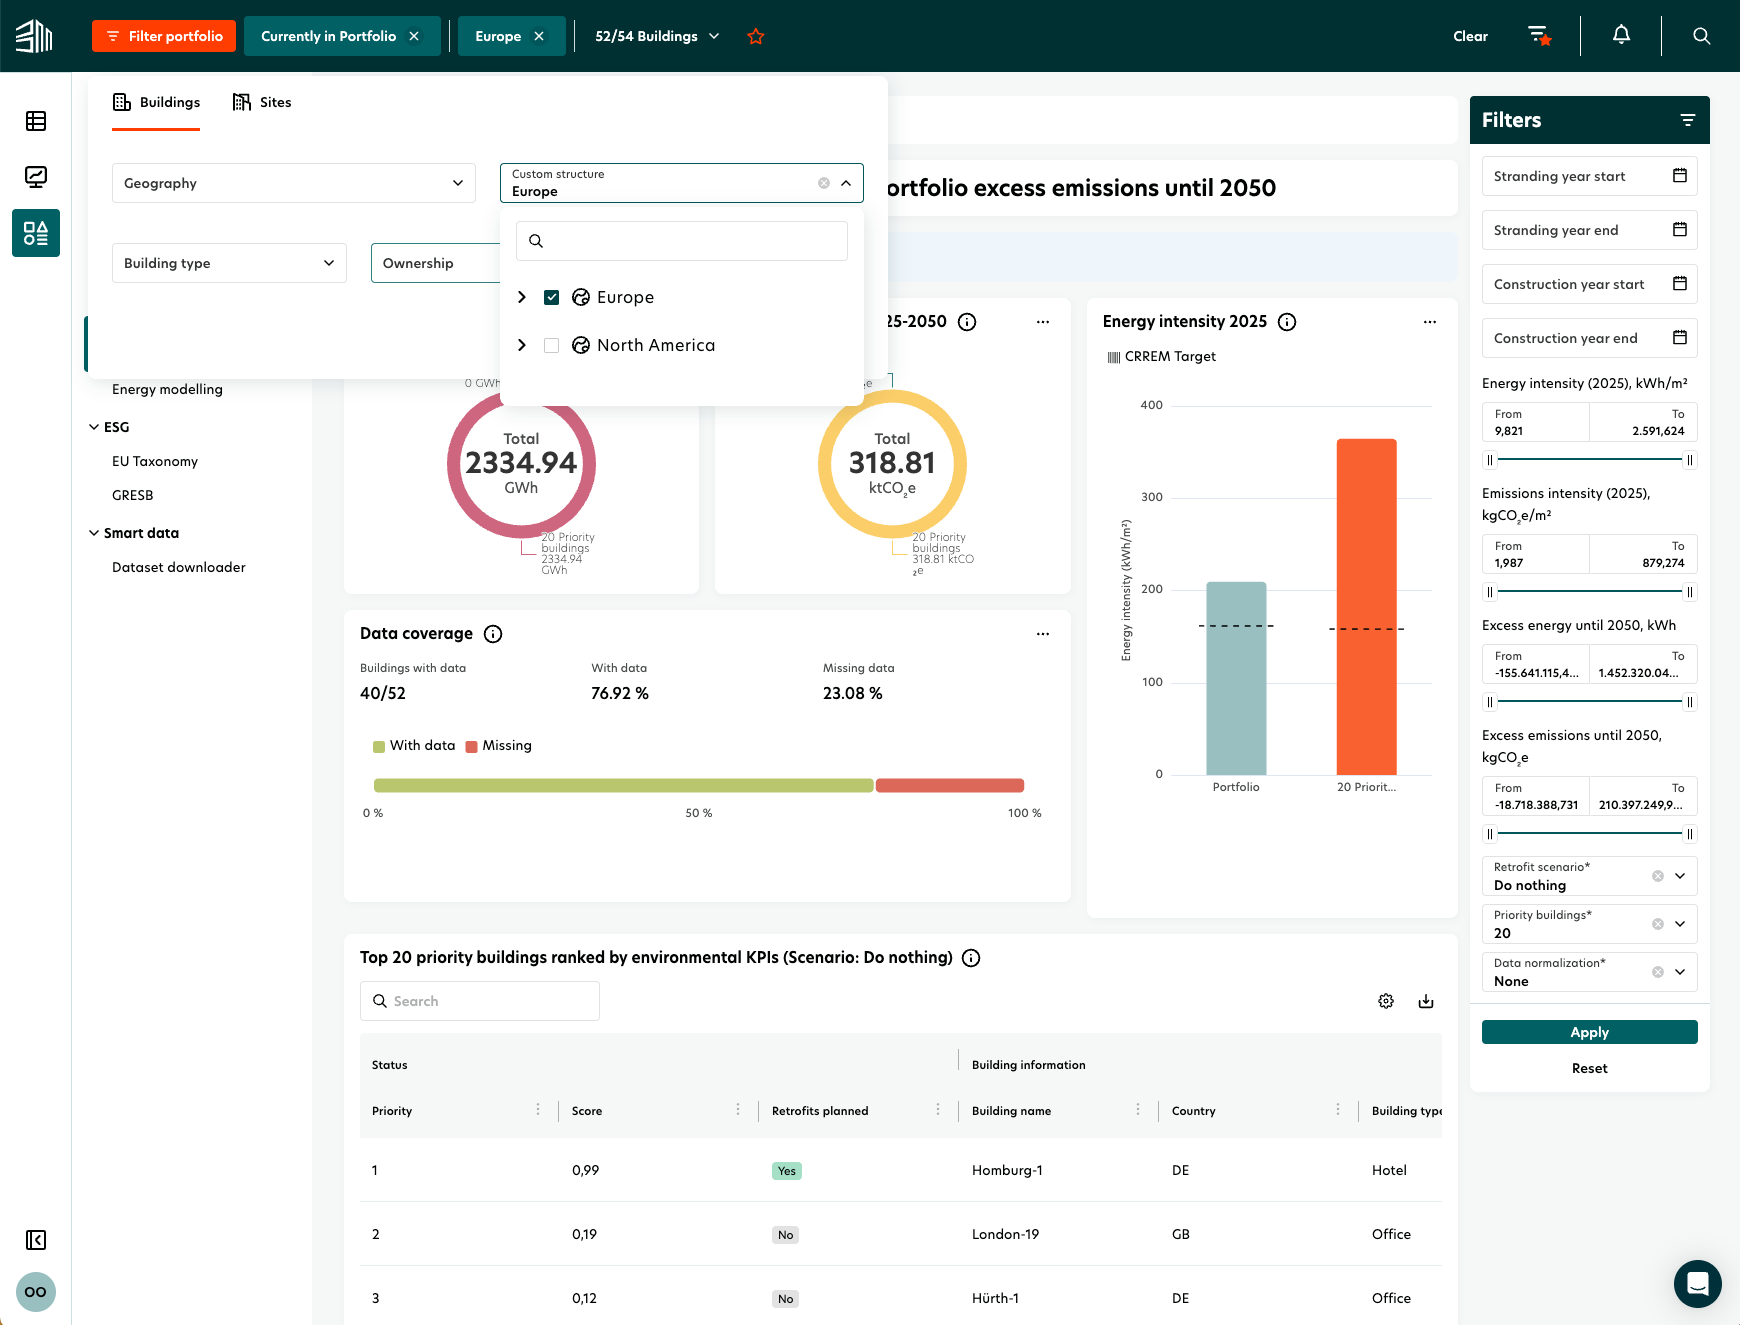
Portfolio filter: Filter by portfolio, ownership type, building status, and more.
Date filters: Filter by construction year or stranding year.
Range filters: Set upper and lower thresholds for energy intensity, emissions intensity, excess emissions, or excess energy.
Scenario selection: Choose between “Do Nothing” (default) or “Decarbonisation” to consider planned retrofit impacts.
Additional options:
Exclude implausible energy data
Apply data normalization (e.g., vacancy or weather adjustment)
Adjust the number of displayed buildings
The date filter is off by default. When enabled, it may exclude buildings without a construction year or stranding status.
Range filters reflect min/max values across all scenarios, normalization, and plausibility settings.
From insight to action
Check the data coverage widget to confirm completeness.
Review the last updated date to ensure data is current.
Use the search bar to locate specific assets quickly.
Hover over widgets to access detailed metrics.
Use the export function to download the list for offline analysis or reporting.