Energy page
On the Energy page, you’ll get insights into energy consumption for your real estate portfolio or a single building. It gives you an overview of energy use, resource breakdowns, procurement types, and building-level performance.
Access the report
Select the Data insights icon in the left menu.
Select the Energy under Resources & emissions report.
Filter Energy report
The Filters section is located just below the top bar, in the upper right corner of the page.
For a detailed overview and explanation of the filters, see filters overview.
Visualizations and Insights
1. Overview
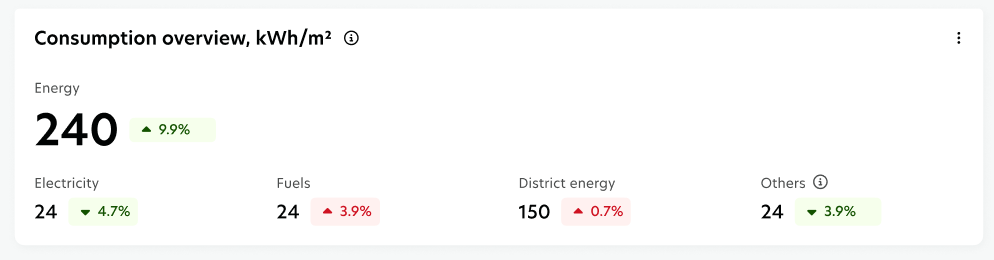
The Overview gives you a quick snapshot of your portfolio’s overall energy consumption, helping you see whether energy efficiency and savings initiatives are delivering results.
Key performance indicators (KPIs)
The KPIs are calculated by energy type (Electricity, Fuels, District Energy, Others) and exclude energy used for electric vehicle charging.
Consumption: shows the total energy used in the selected buildings and for the selected time period, calculated in absolute value or intensity. Electricity that is self-generated and exported is excluded.
Net energy demand: shows the total energy used in the selected buildings and for the selected time period, calculated in absolute value or intensity, excluding electricity that is self-generated and exported, as well as self-generated and consumed.
Year-over-year (YoY) change: highlights the percentage change in consumption or demand between the selected period and the same period last year.
Copy as image: You can click the three-dot icon and select “Copy to clipboard” to save the visual as an image.
2. Consumption by resource type
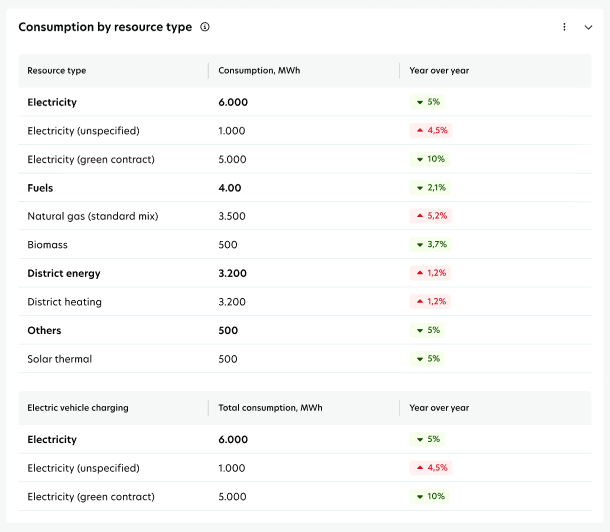
This visualization shows you which energy sources drive consumption, helping you spot opportunities to reduce costs and emissions, e.g., by shifting from fossil fuels to renewables.
Key performance indicators (KPIs)
Consumption: shows the total energy used in the selected buildings and for the selected time period, excluding electricity that is self-generated and exported (calculated in absolute value or intensity).
Net energy demand: shows the total energy used in the selected buildings for the selected time period, excluding electricity that is self-generated and exported, as well as self-generated and consumed (calculated in absolute value or intensity).
Year-over-year (YoY) change: highlights the percentage change in consumption or demand between the selected period and the same period last year.
Tables
First table: KPIs are calculated by energy type (Electricity, Fuels, District Energy, Others) and subtypes (e.g., electricity from green contracts, solar thermal). Energy used for electric vehicle charging is excluded.
Second table: KPIs are calculated for energy used exclusively for electric vehicle charging (not related to building usage).
Download data: You can export data from both tables to a CSV or Excel file using the download icon above the first table and selecting your preferred export format.
3. Development over time
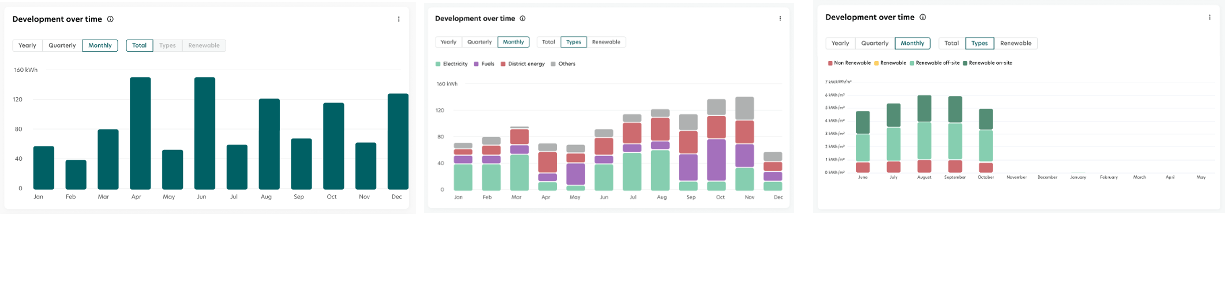
This chart helps you spot seasonal peaks, shifts in energy mix, and long-term consumption patterns, supporting your energy budgeting and operational planning.
The split by energy types shows which sources drive consumption in your portfolio or building over time. The split by renewable types gives you a clear view of how much renewable energy is used across time.
Key performance indicators (KPIs)
The KPIs are calculated for energy by type (Electricity, Fuels, District Energy, Others) and by renewable type (Renewable off-site, Renewable on-site, Unspecified, Non-renewables). Energy used for electric vehicle charging is excluded.
Yearly/Quarterly/Monthly total consumption: shows the energy used per year, quarter, or month in the selected buildings for the selected time period, plus the three previous years. Electricity that is self-generated and exported is excluded.
Yearly/Quarterly/Monthly net energy demand: same as above, but also excludes electricity that is self-generated and consumed.
Copy as image: You can click the three-dot icon and select “Copy to clipboard” to save the visual as an image.
4. Consumption by procurement type
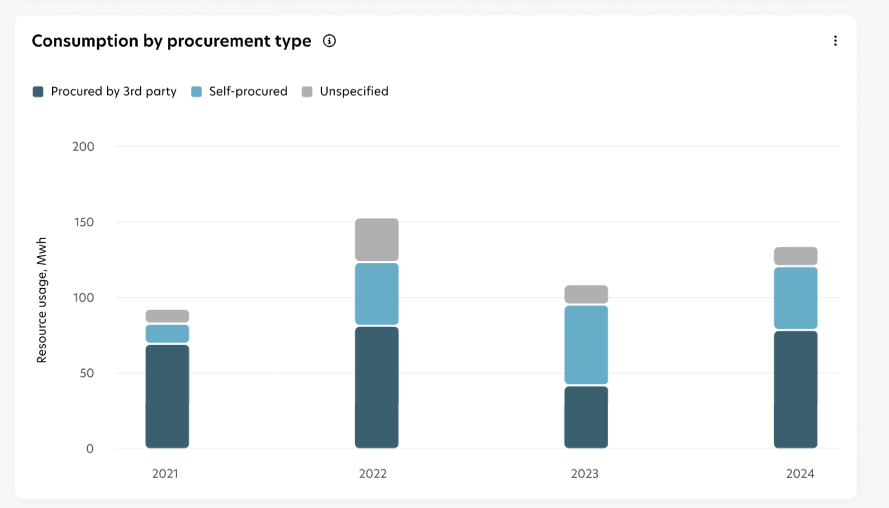
This chart shows how much of your energy mix is under direct control versus managed by third parties, which can influence your negotiation power and energy strategy.
Key performance indicators (KPIs)
The KPIs are calculated by procurement type (third-party procured, self-procured, unspecified) and exclude energy used for electric vehicle charging.
Yearly total consumption by procurement type: shows the energy used per procurement type each year in the selected buildings for the selected time period, plus the three previous years. Electricity that is self-generated and exported is excluded.
Yearly net energy demand by procurement type: same as above, but also excludes electricity that is self-generated and consumed.
Copy as image: You can click the three-dot icon and select “Copy to clipboard” to save the visual as an image.
5. Building performance
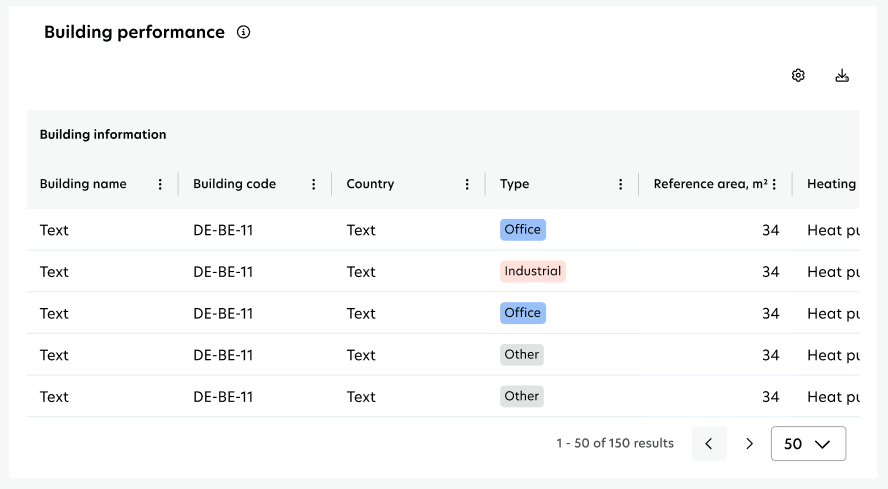
This table supports benchmarking and portfolio comparison, helping you quickly identify high- and low-performing buildings within the same category.
Key performance indicators (KPIs)
You’ll see the following KPIs for each building:
Building information: building name, code, country, type, reference area, and heating type.
Consumption: shows the total energy used per energy type during the selected time period, excluding electricity that is self-generated and exported.
Self-generated energy: displays the total electricity that is self-generated and used per building during the selected time period.
Exported energy: shows the total electricity that is self-generated and exported per building during the selected time period.
Non-operational energy: displays the total energy used for electric vehicle charging only, per building and for the selected time period.
Year-over-year: shows the percentage change in consumption or demand between the selected time period and the same period last year, for each building.
Download data: You can export data from the table to a CSV or Excel file using the download icon above the first table and selecting your preferred export format.