Energy performance certificates (EPCs)
The EPCs report provides insights into the energy efficiency of their buildings. It helps track compliance with regulatory standards such as SFDR and EU Taxonomy by displaying valid EPCs and their classifications.
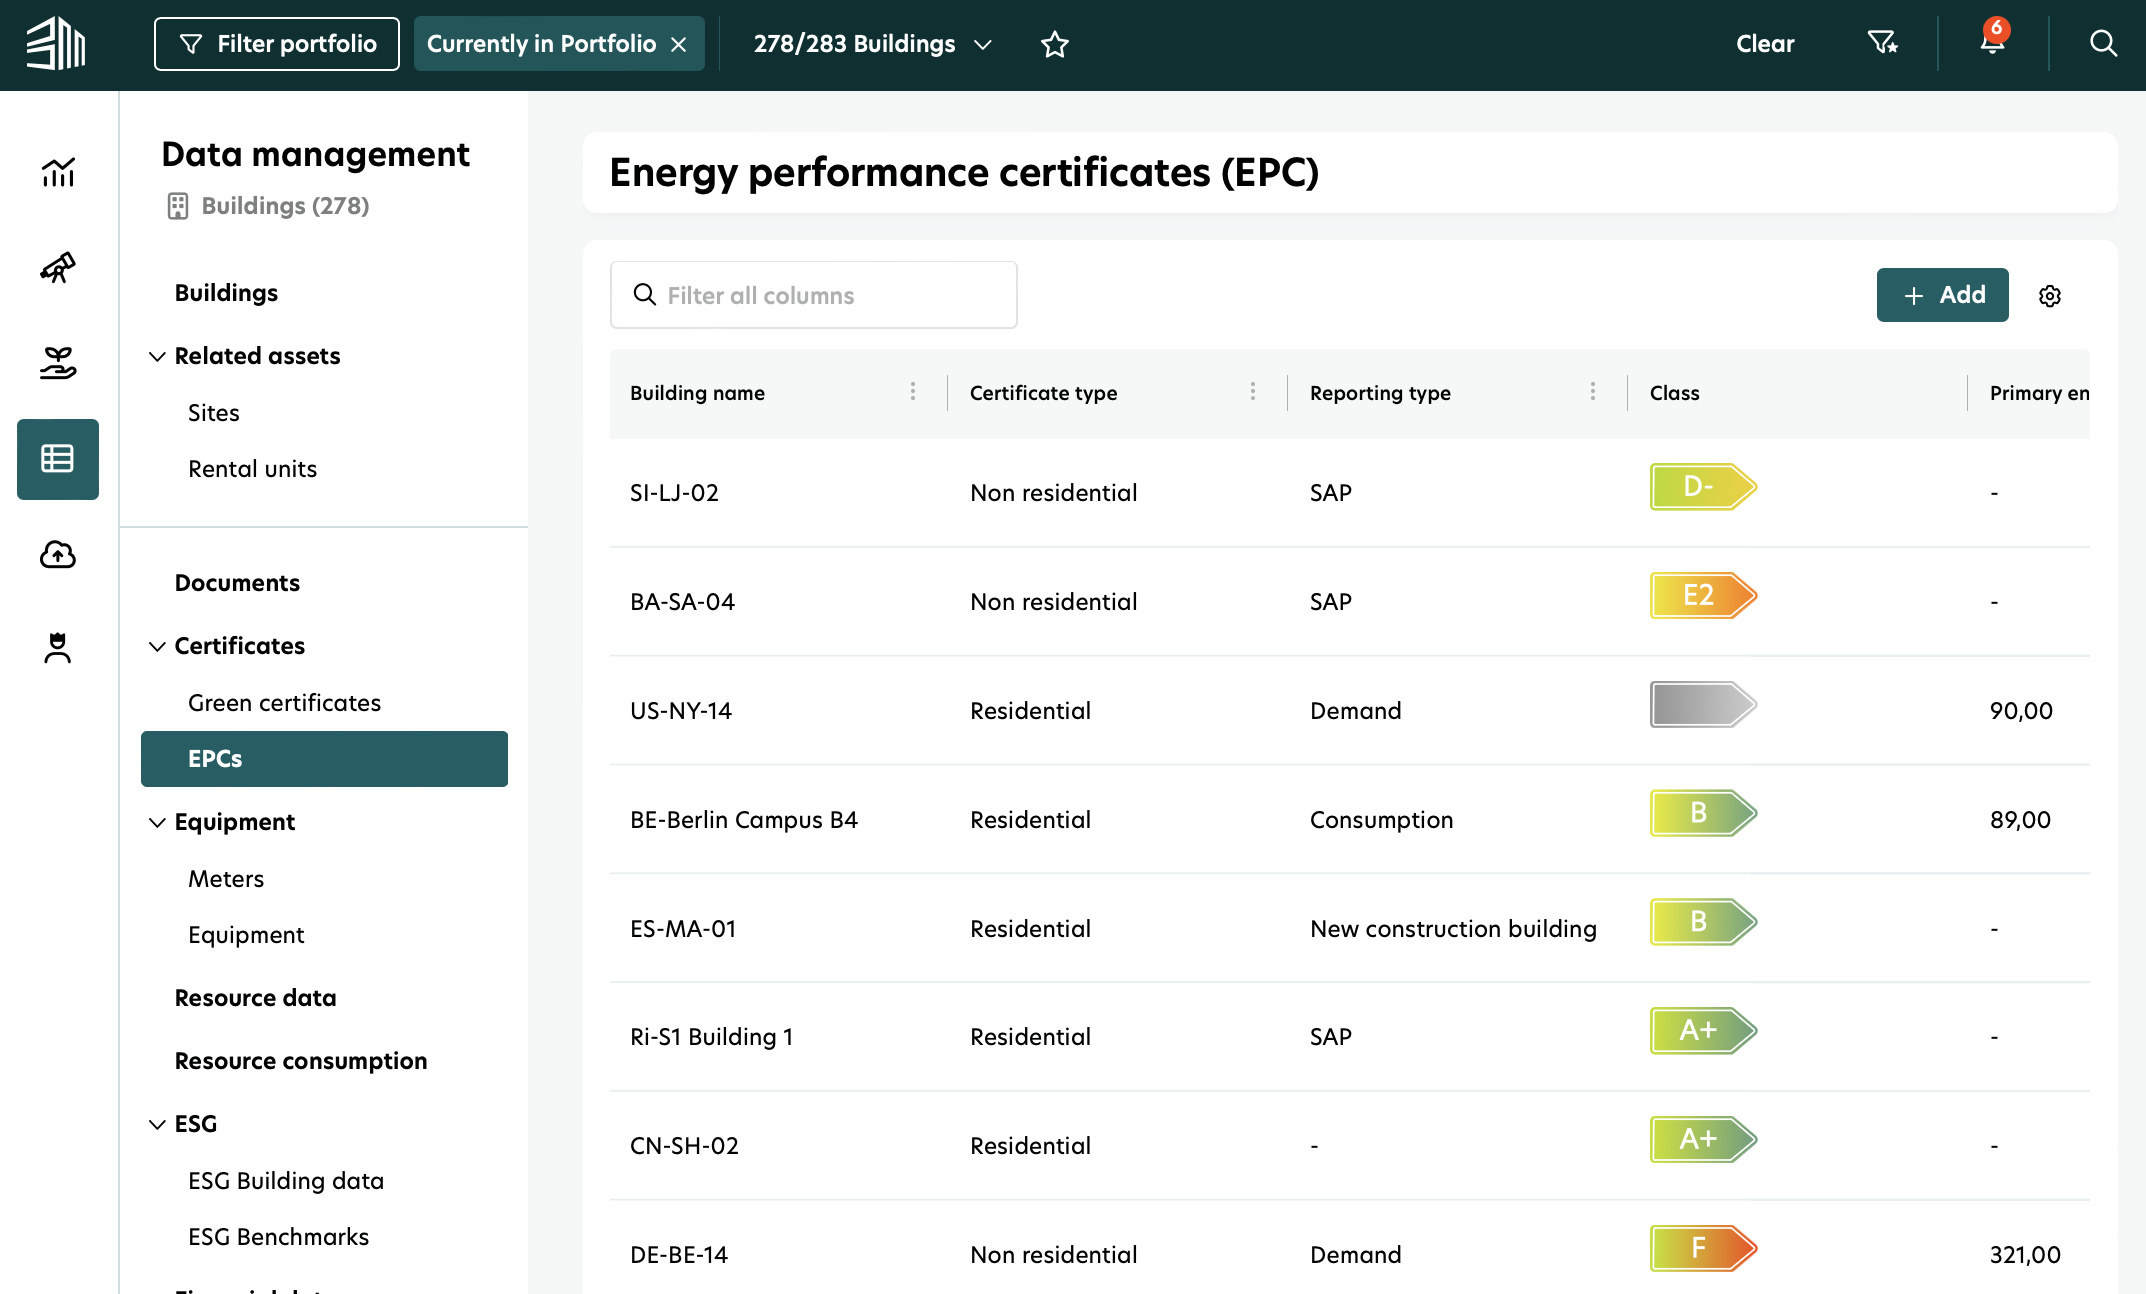
Access EPCs report
Navigate to the Data management tab from the left-hand menu.
Click on EPCs under Certificates.
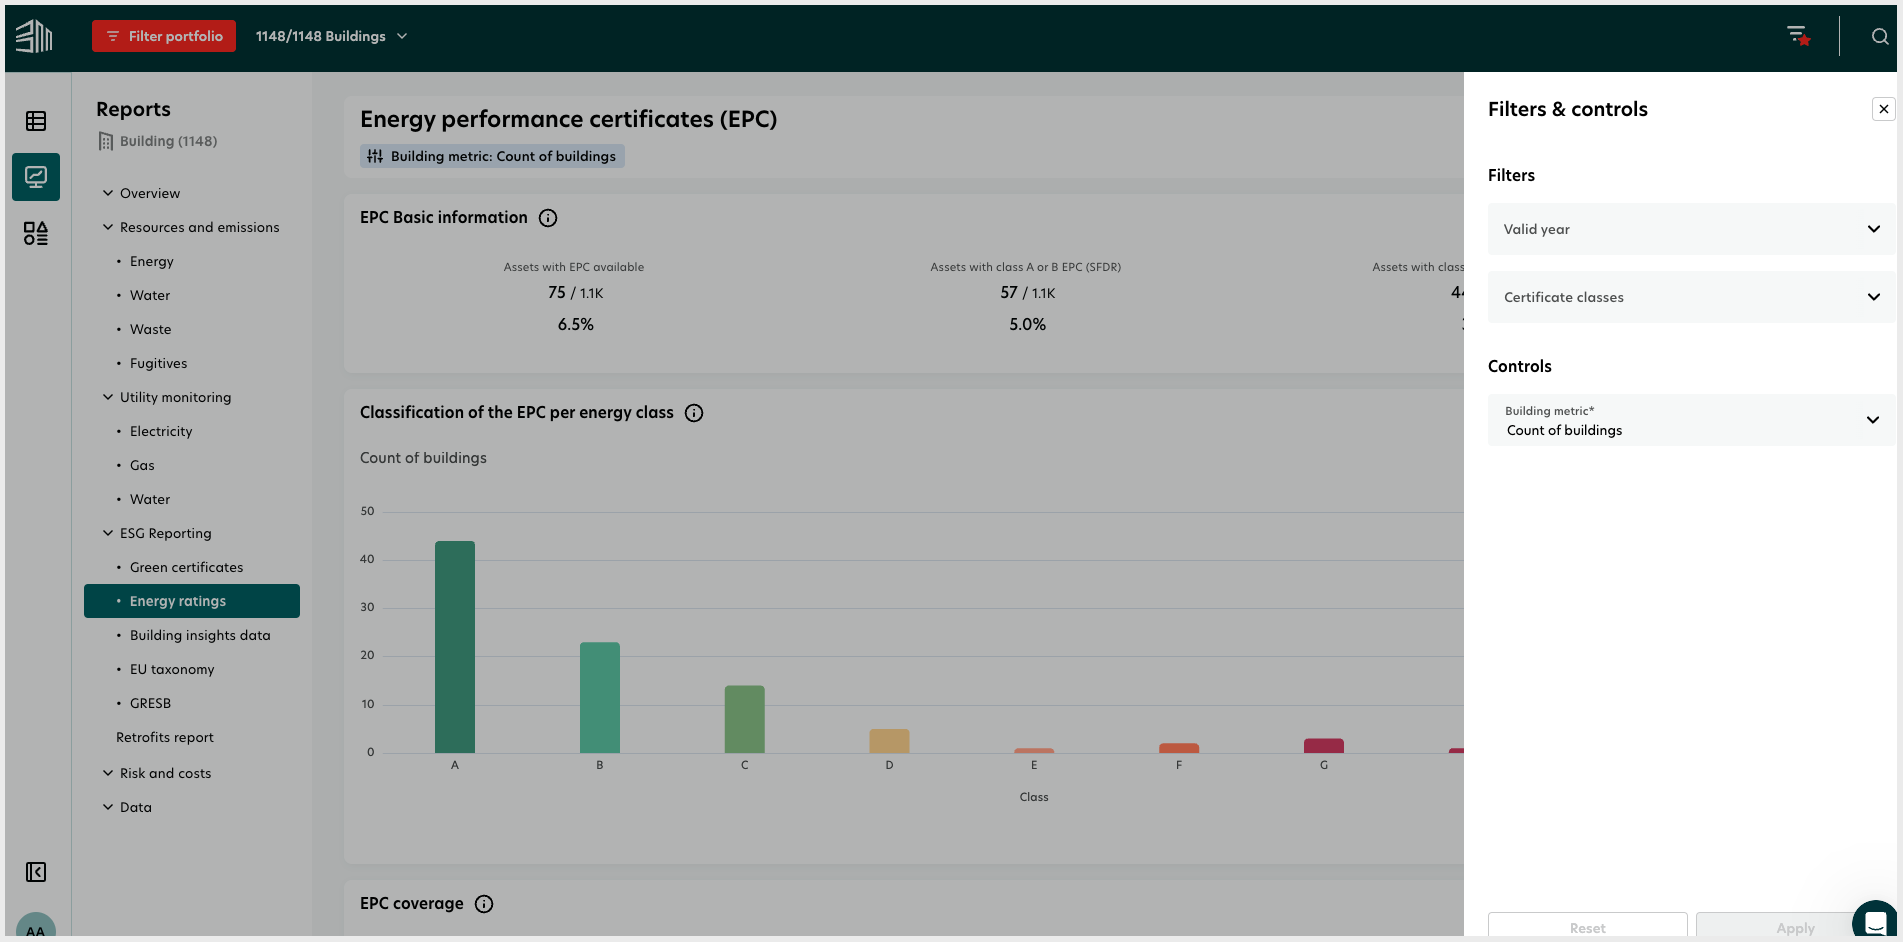
Filters for report customization
To control the EPCs report, you can apply:
Valid year: Select a future year to analyze EPC validity.
Certificate classes: Filter buildings by energy class.
Building metrics (affects charts and summary cards):
Count of buildings
Energy reference area
Gross asset value
These filters apply to the entire report.
Key Performance Indicators (KPIs)
Four charts show the KPIs.
Chart 1: EPC Basic information
This chart displays:
Assets with EPCs available: Shows the share of valid EPCs at the building or portfolio level.
Assets with Class A or B EPCs (SFDR): Highlights buildings that comply with SFDR regulations.
Assets with Class A EPCs (EU Taxonomy): Identifies buildings aligned with EU Taxonomy without additional comparison.
Note: This data represents the number of assets, not the number of EPCs.
All the above-mentioned KPIs concerning the energy reference area and gross asset value will also be available.
This chart provides an overview of the number of buildings with valid EPCs, the proportion of those with high energy efficiency ratings (Class A or B under SFDR, and Class A under EU Taxonomy), and their share in the portfolio.
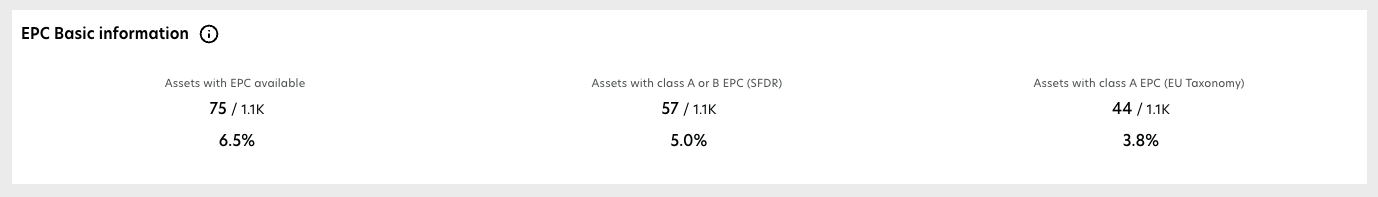
Chart 2: EPC classifications by energy class
This bar chart categorizes valid EPCs based on their energy class. When hovering over the bars, users can view:
Energy class
Total gross asset value (GAV) associated with the class
Total valid EPCs
This bar chart shows the distribution of EPCs across different energy classes, allowing users to assess how their portfolio is categorized. Users can view the total GAV and the number of valid EPCs per class.
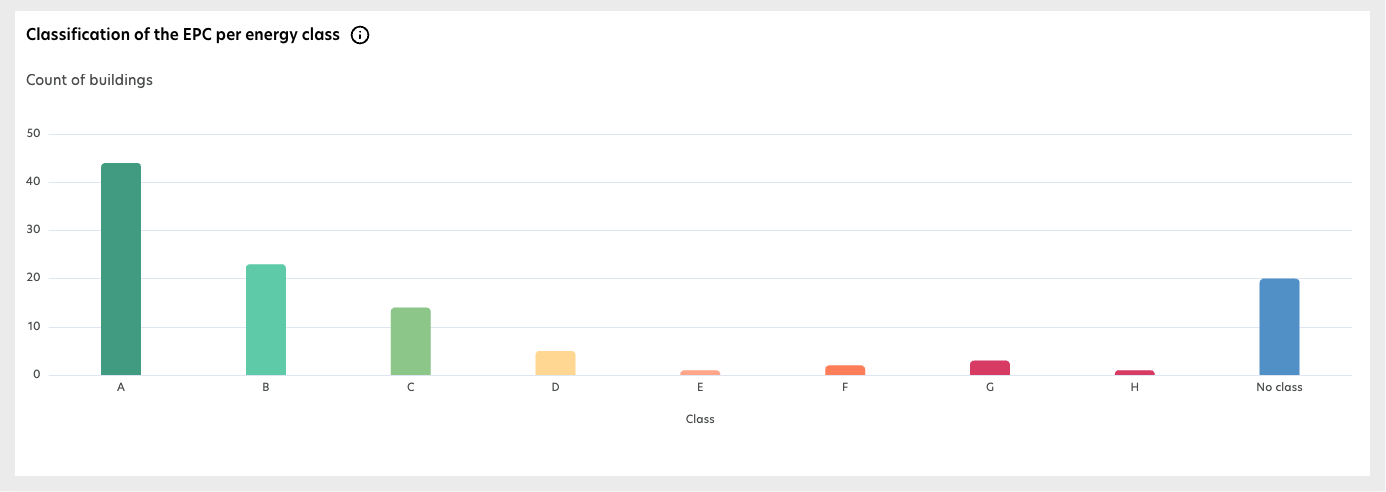
Chart 3: EPC coverage
This chart shows the geographic distribution of valid and missing EPCs, broken down by:
Continent
Country
Region
Site
This chart presents a breakdown of the EPC coverage across different geographical levels, including continent, country, region, and site. It visually represents buildings with and without valid EPCs, helping users identify gaps in certification.
Sustainability managers/asset managers can check the number of their buildings that have valid EPCs at any given level, plus the asset value and reference area covered by those EPCs.
Property managers can have a view on their site level and can take appropriate actions.
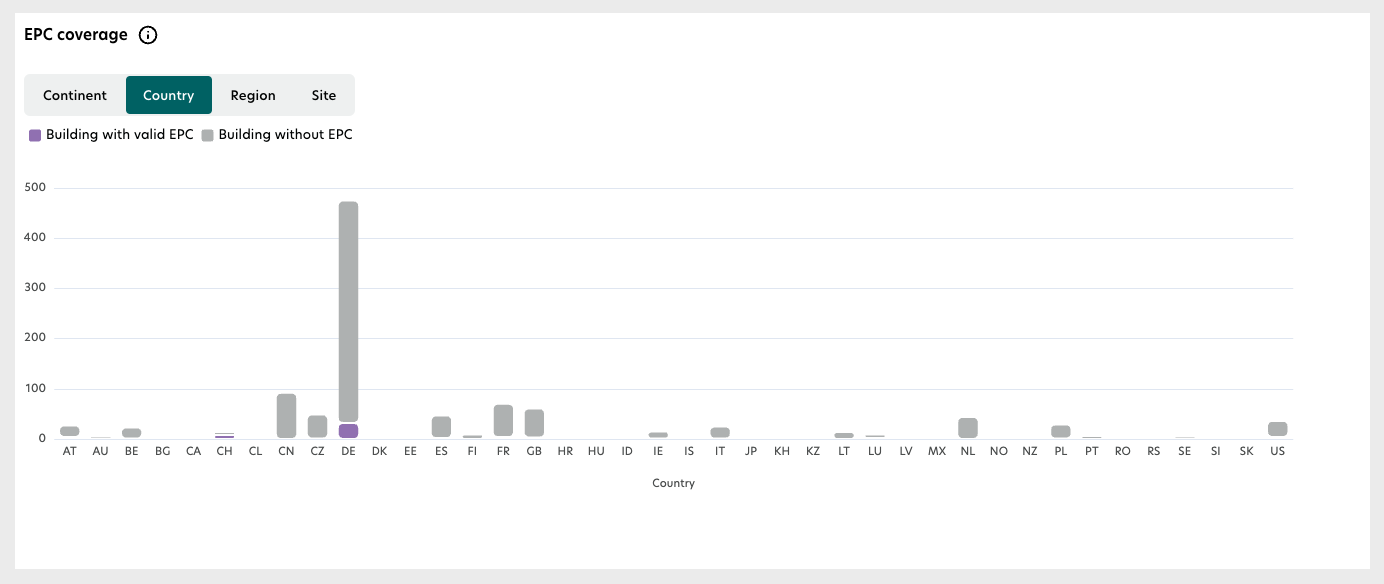
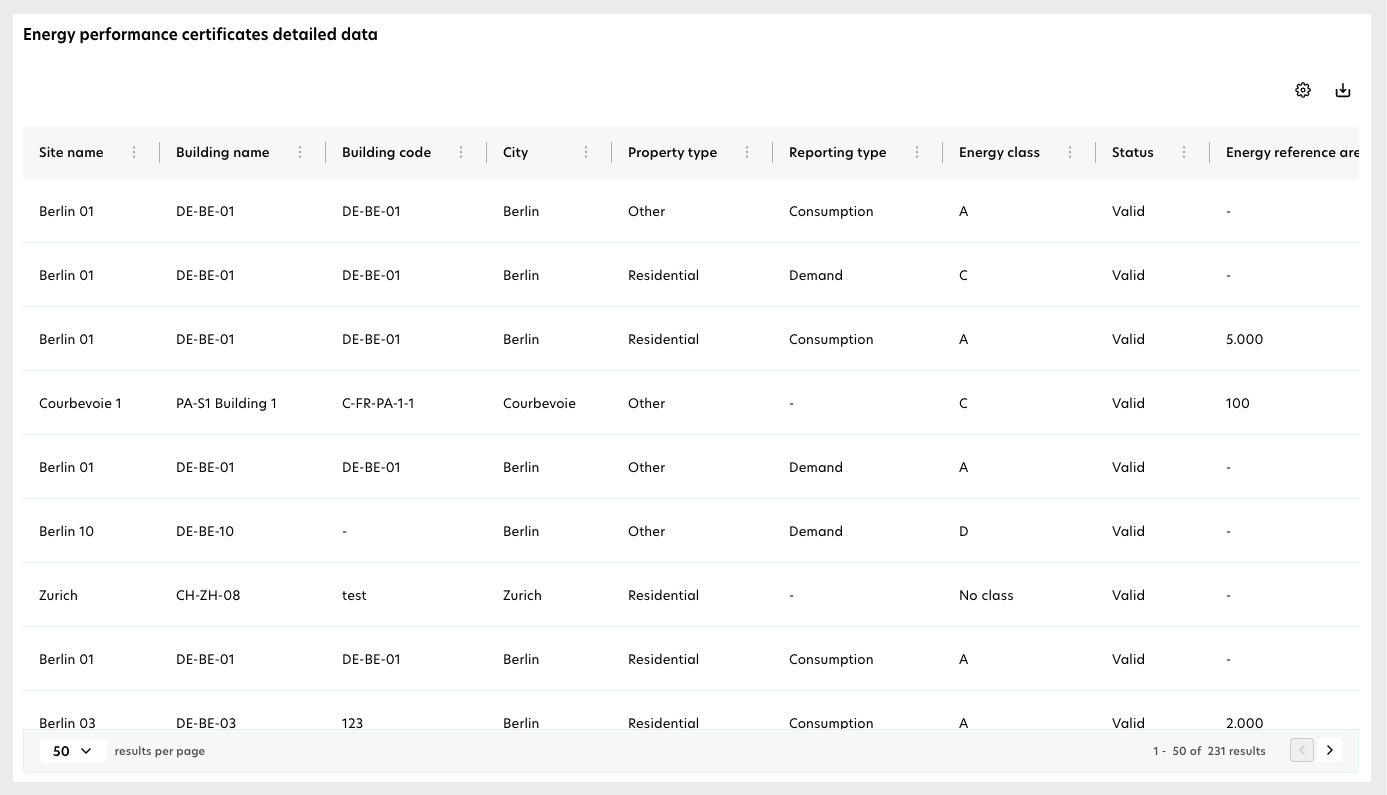
Chart 4: Energy performance certificates detailed data
This detailed breakdown table provides a downloadable .CSV or .XLS file with details such as:
Building and site details: Name, code, city, and property type.
EPC specifics: Energy class, validity date, and status.
Energy-related metrics: Final energy, primary energy, and NZEB status.
Customization options: Expand, hide, or sort columns as needed.
This table contains a comprehensive list of EPC details, including energy class, validity, and energy performance metrics. You can download this data for further analysis and reporting.